Summary
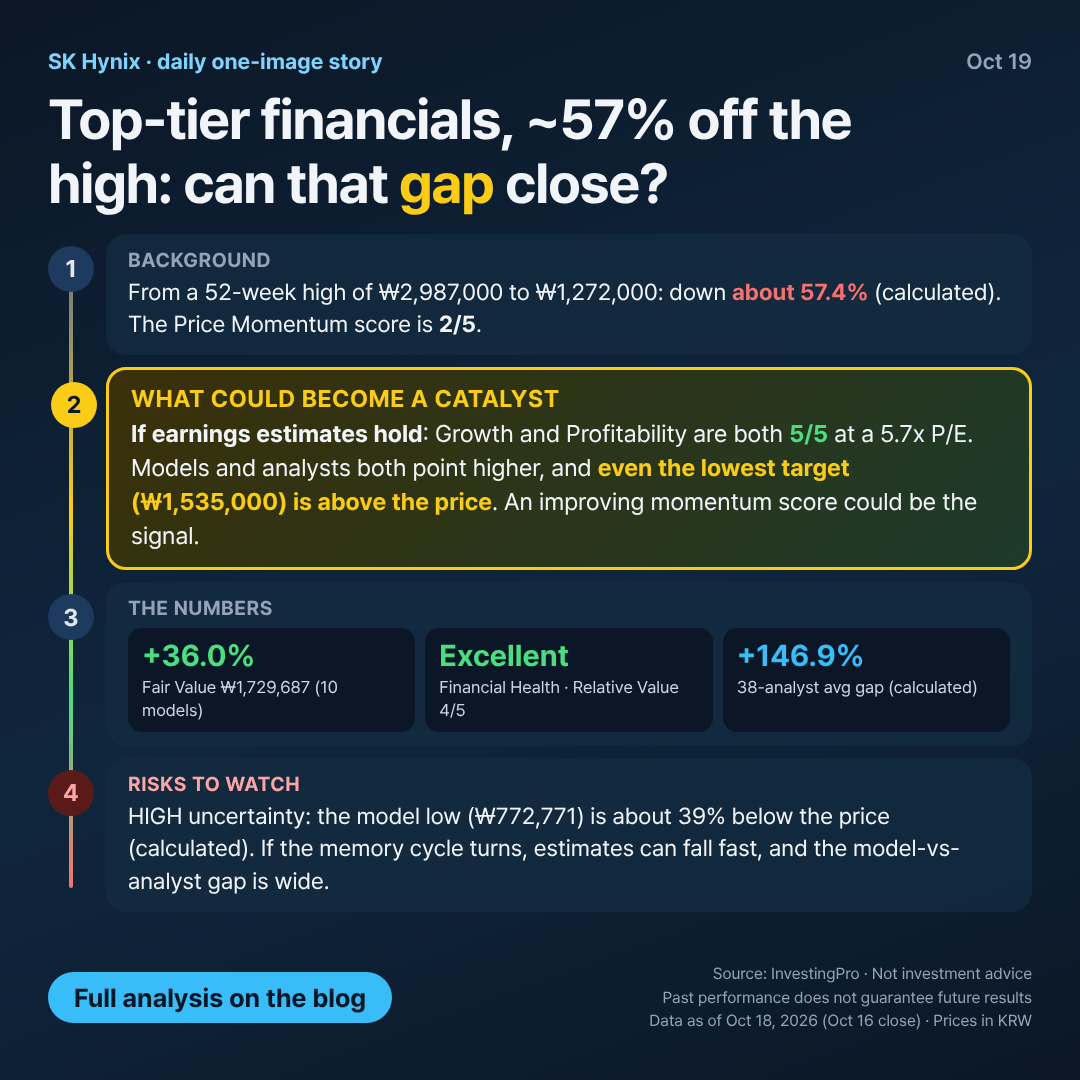
SK Hynix ₩1,272,000 · Fair Value ₩1,729,687.44 (+36.0%) · Financial Health: Excellent (uncertainty: HIGH)
Business Overview
SK Hynix researches, develops, manufactures and sells semiconductor devices, chiefly memory. It trades on KOSPI in the Semiconductors & Semiconductor Equipment industry. Its market cap is ₩927,116.9B. Memory is a cyclical business: earnings swing with pricing, so valuation models swing with them.
Valuation: Fair Value vs. Analyst Targets
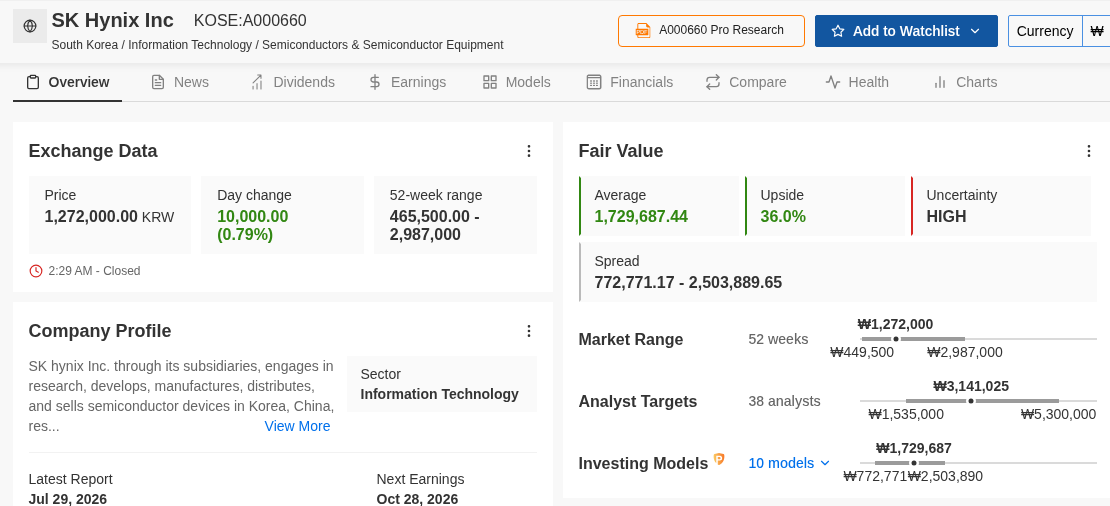
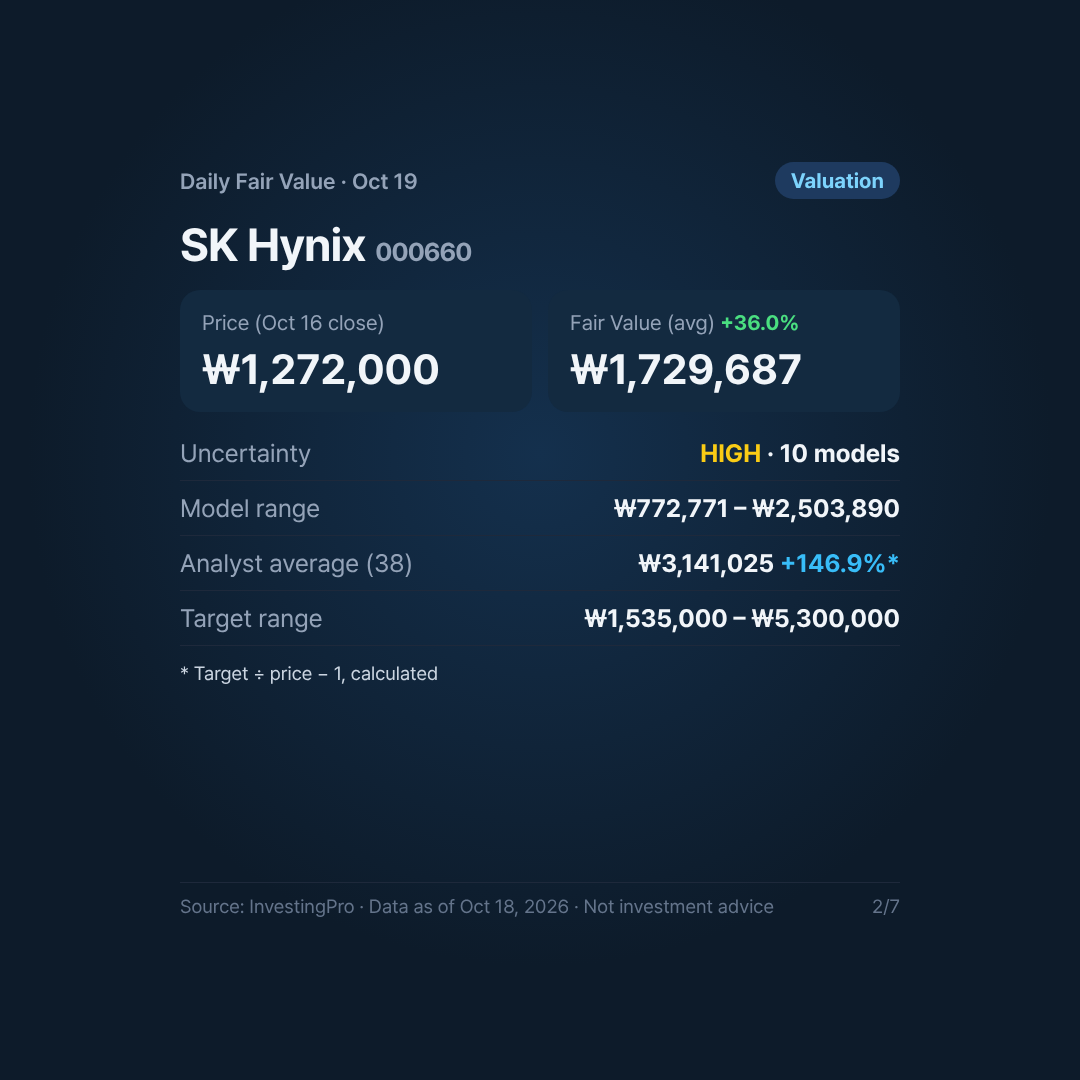
| Metric | Value |
|---|---|
| Price (Oct 16 close) | ₩1,272,000 |
| Fair Value average | ₩1,729,687.44 (+36.0%) |
| Uncertainty | HIGH |
| Model spread (10 models) | ₩772,771.17 to ₩2,503,889.65 |
| Analyst average (38 analysts) | ₩3,141,025 (+146.9%, calculated) |
| Analyst target range | ₩1,535,000 to ₩5,300,000 |
| P/E / Dividend yield | 5.7x / 0.2% |
Analyst upside is calculated as average target ÷ price − 1; it is not displayed by InvestingPro.
A very wide model range
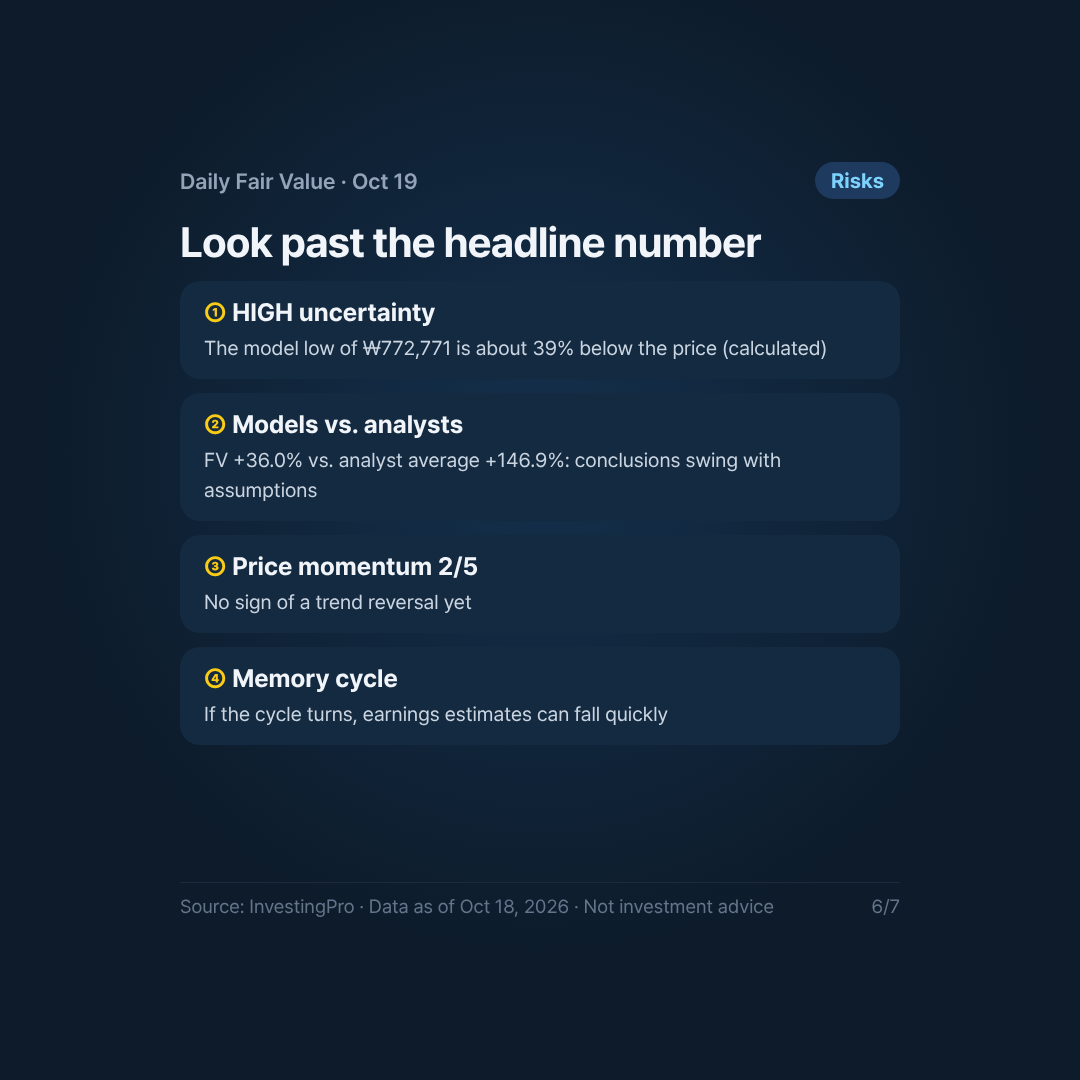
With HIGH uncertainty, the spread is about 100% of the Fair Value average (calculated). The low end (₩772,771) is about 39% below the current price; the high end (₩2,503,890) is about 97% above it. The +36.0% figure is the midpoint of a very broad distribution.
Analysts are far more bullish than the models
The analyst average is about 81.6% above the Fair Value average (calculated) and above the top of the model spread. Even the lowest target (₩1,535,000) is above the current price. Both point upward. But the size of the gap shows how much the result depends on earnings assumptions. Samsung Electronics shows the same pattern; see our Fair Value Spotlight for the week of Oct 19.
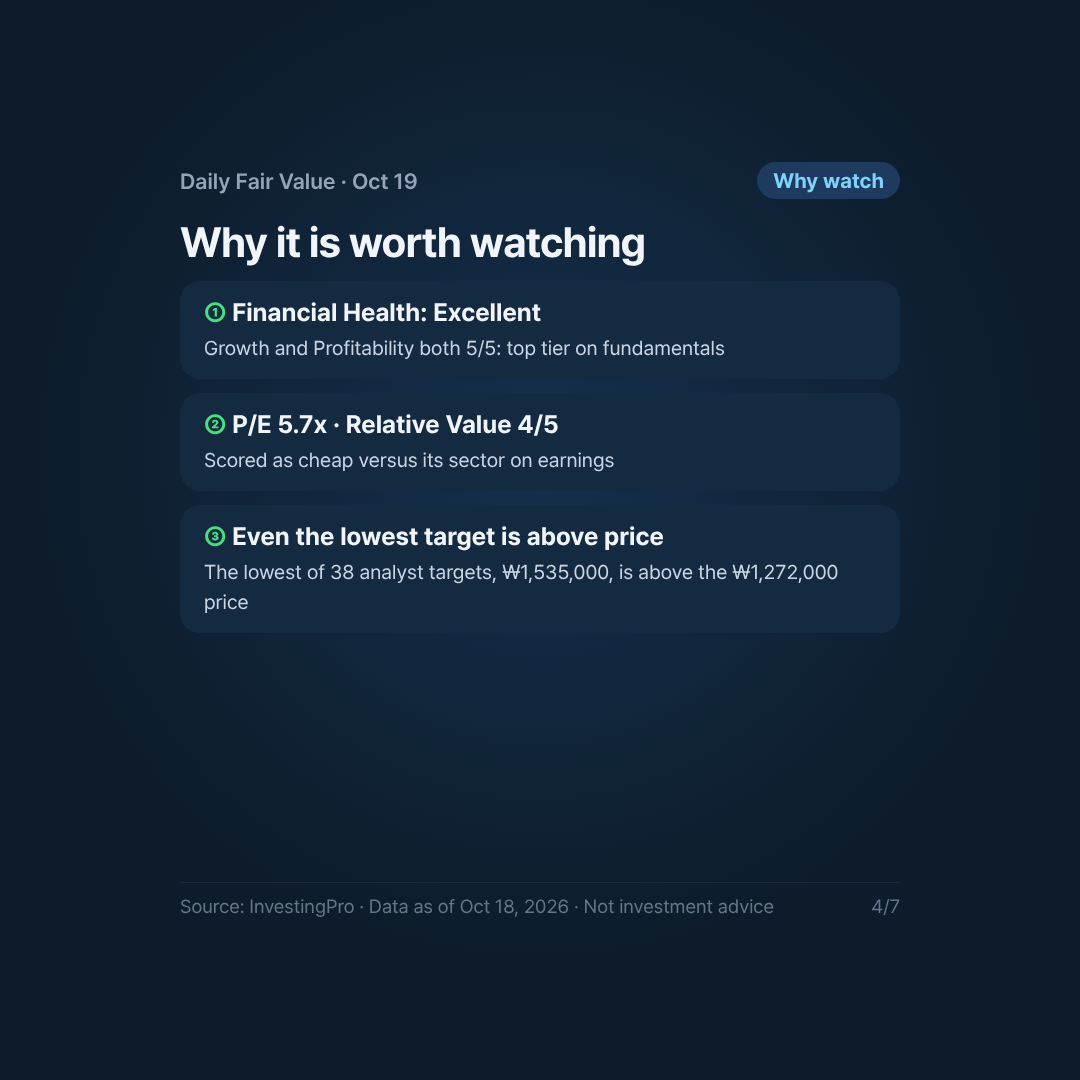
Financial Health: Excellent
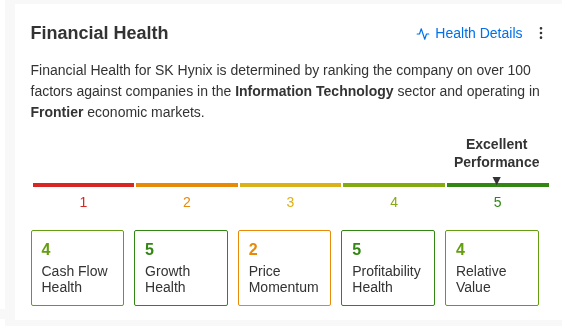
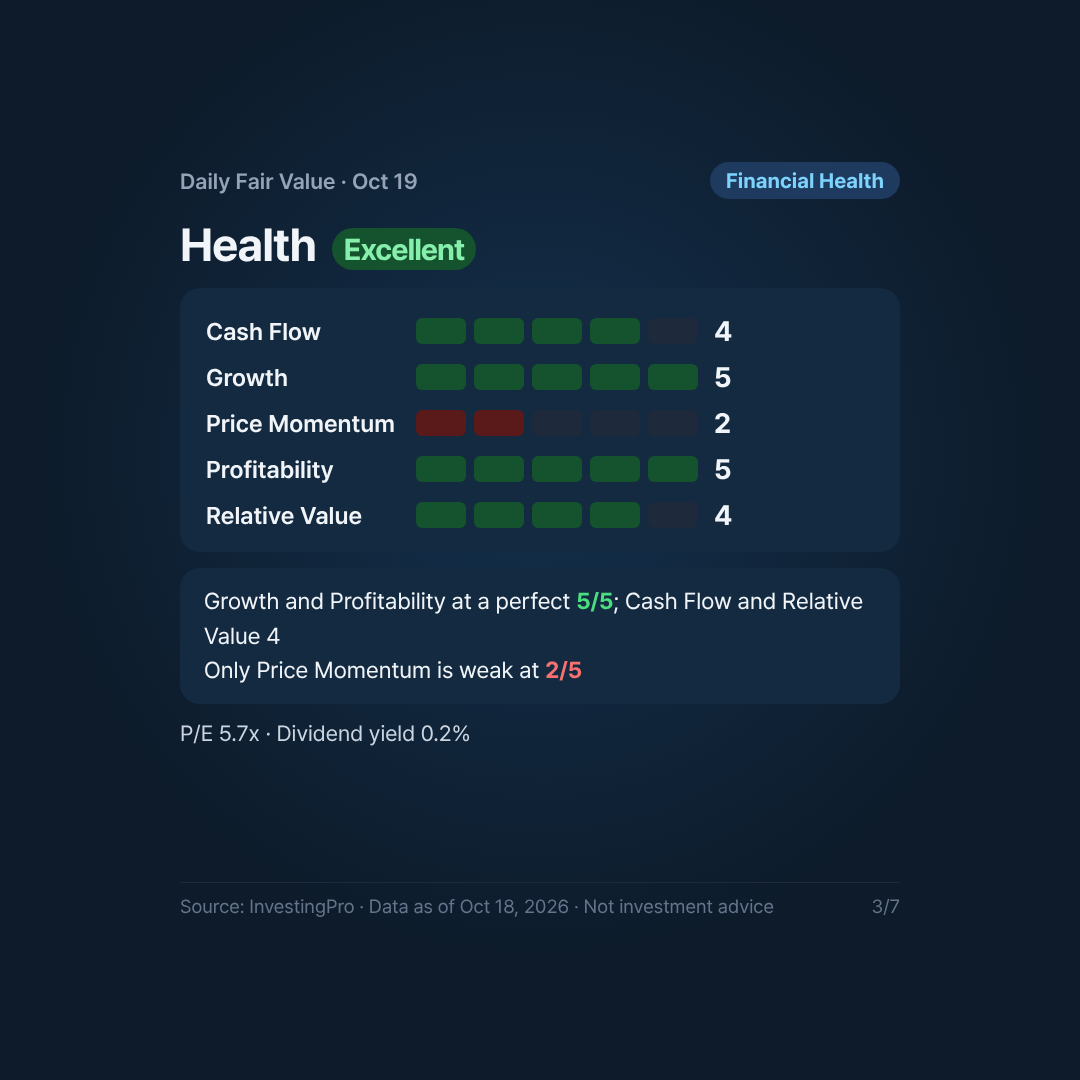
| Sub-score | Score (1-5) | Read-through |
|---|---|---|
| Cash Flow | 4 | Solid cash generation |
| Growth | 5 | Top tier |
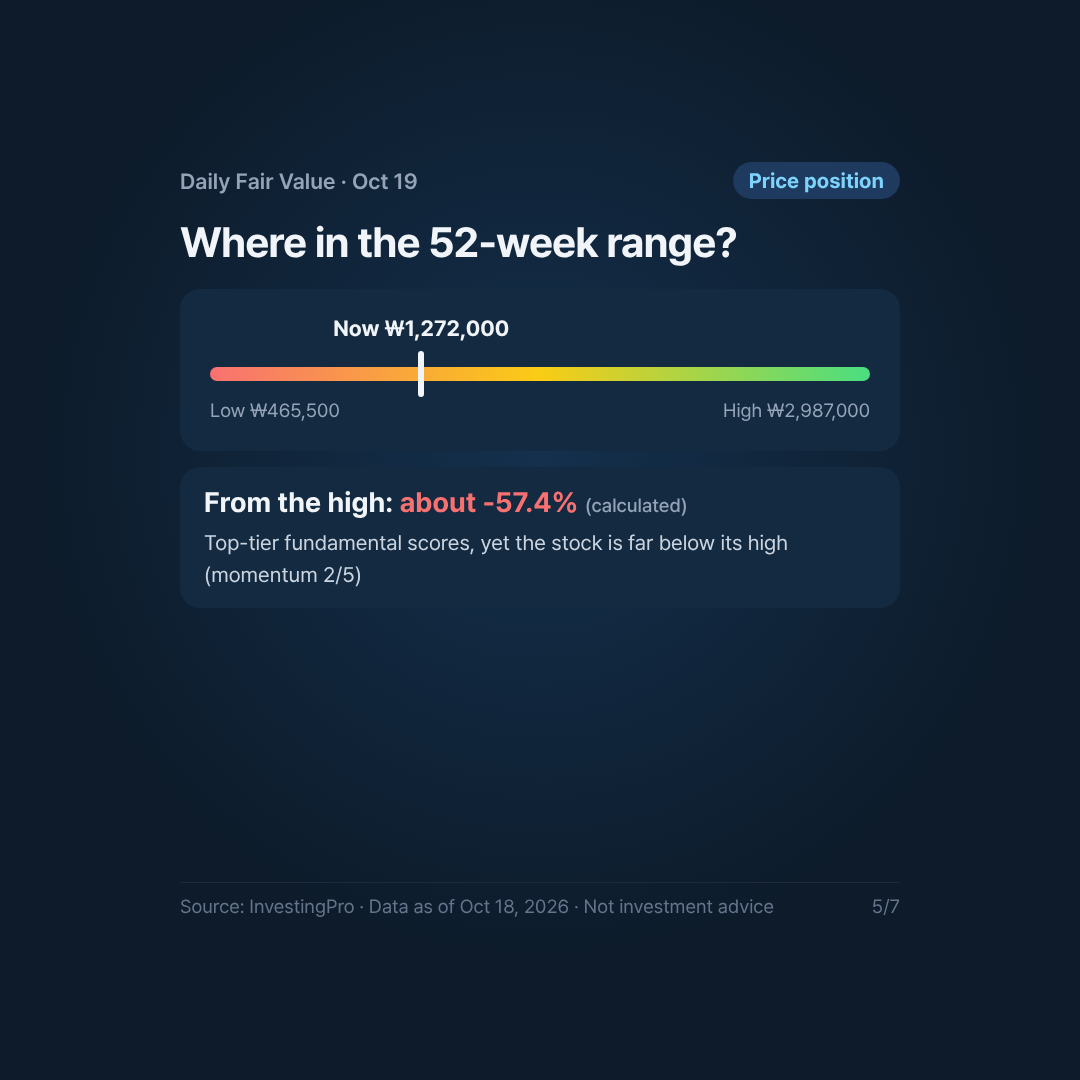
| Price Momentum | 2 | Weak; price is about 57.4% below the 52-week high of ₩2,987,000 (calculated) |
| Profitability | 5 | Top tier |
| Relative Value | 4 | Cheap vs. sector, consistent with a 5.7x P/E |
Growth and Profitability are maxed out, and Cash Flow and Relative Value score 4. The only weak link is Price Momentum at 2: top-tier fundamentals with a stock that sits well below its high.
Risks
- HIGH uncertainty: the Fair Value average carries a wide band.
- Model-vs-analyst gap: +36.0% vs. +146.9% (calculated). Quoting either number alone misleads.
- Weak momentum (2/5): no sign yet of a trend reversal.
- Memory cycle: if pricing turns, estimates fall fast, and a 5.7x P/E can rise quickly as earnings shrink.
Implications (not a recommendation)
SK Hynix is a case of excellent fundamentals with mixed price signals. A low P/E and strong scores support the model upside. But HIGH uncertainty, weak momentum and cyclical earnings mean the +36% should not be read too literally. Watch whether earnings estimates hold, whether the analyst-vs-model gap narrows, and whether momentum improves. SK Hynix is not one of the 20 holdings in InvestingPro’s KOSPI20 strategy; see our KOSPI20 ProPicks review for October 2026.
This content is an analysis based on InvestingPro data and is not investment advice. Past performance does not guarantee future results.
Data as of October 18, 2026 (October 16 close). Source: InvestingPro
1 thought on “SK Hynix Fair Value Analysis: Is the Stock Undervalued? (Oct 2026)”
Comments are closed.