Data as of October 18, 2026 (InvestingPro). All prices in KRW. Strategy performance figures are backtested.
KOSPI20 ProPicks October 2026: The Rebalance at a Glance
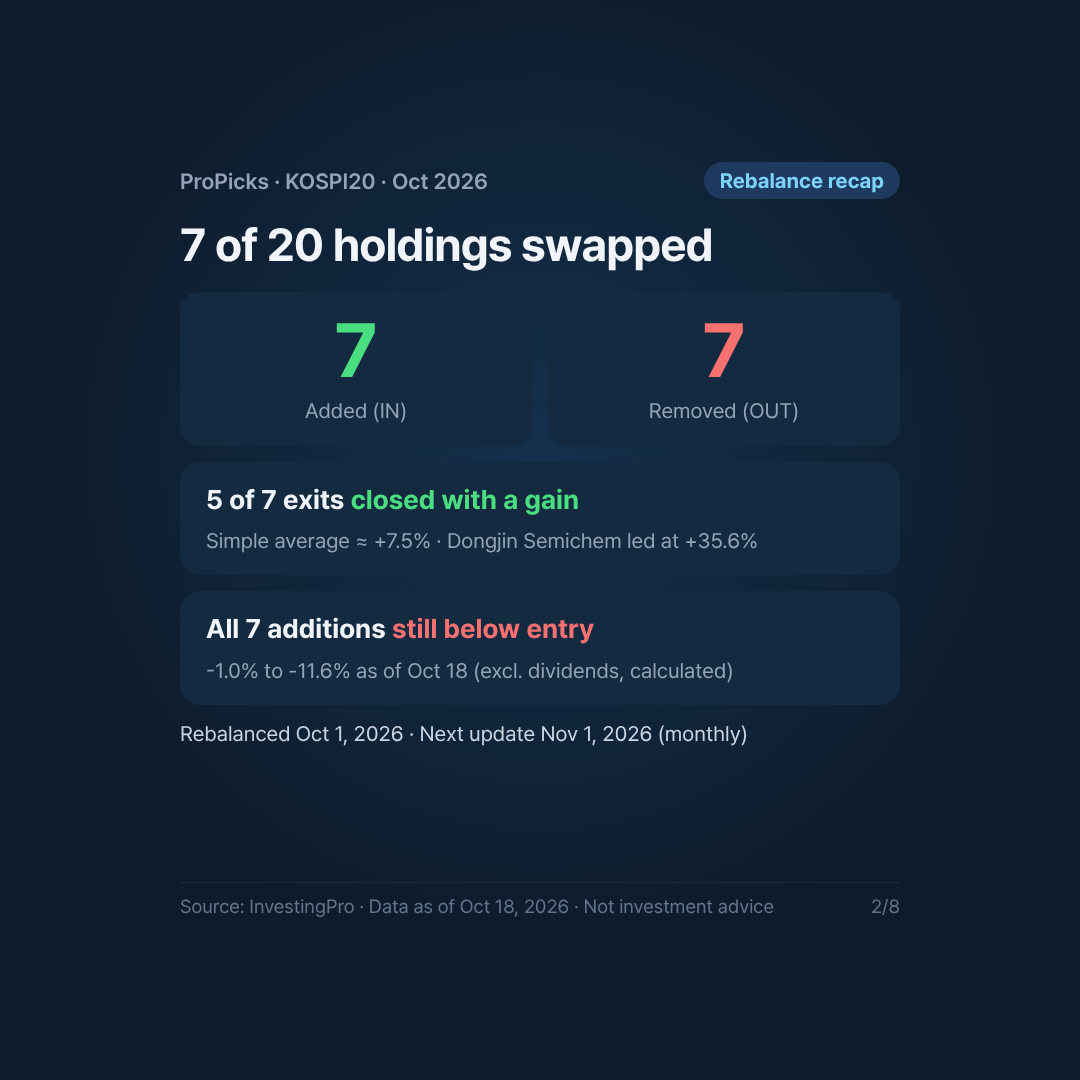
InvestingPro’s Korean Market Leaders (KOSPI20) strategy is an AI-driven ProPicks portfolio. It holds up to 20 large-cap South Korean stocks, is rebalanced monthly and has a low risk profile. The latest rebalance came on October 1, 2026. It was one of the bigger reshuffles: 7 stocks in and 7 stocks out, so about a third of the portfolio turned over in one month.
The direction of the trade is clear from the selection themes. Out went a cluster of semiconductor-materials and cyclical winners that had already paid off (Dongjin Semichem, S&S Tech). In came names that InvestingPro tags as “Deep Value” or “Cheap Stock”. Most pair that with a growth angle, such as AI or order momentum.
| Metric | Value |
|---|---|
| Rebalance date | Oct 1, 2026 (monthly; next update Nov 1, 2026) |
| Changes | 7 added, 7 removed (20 holdings) |
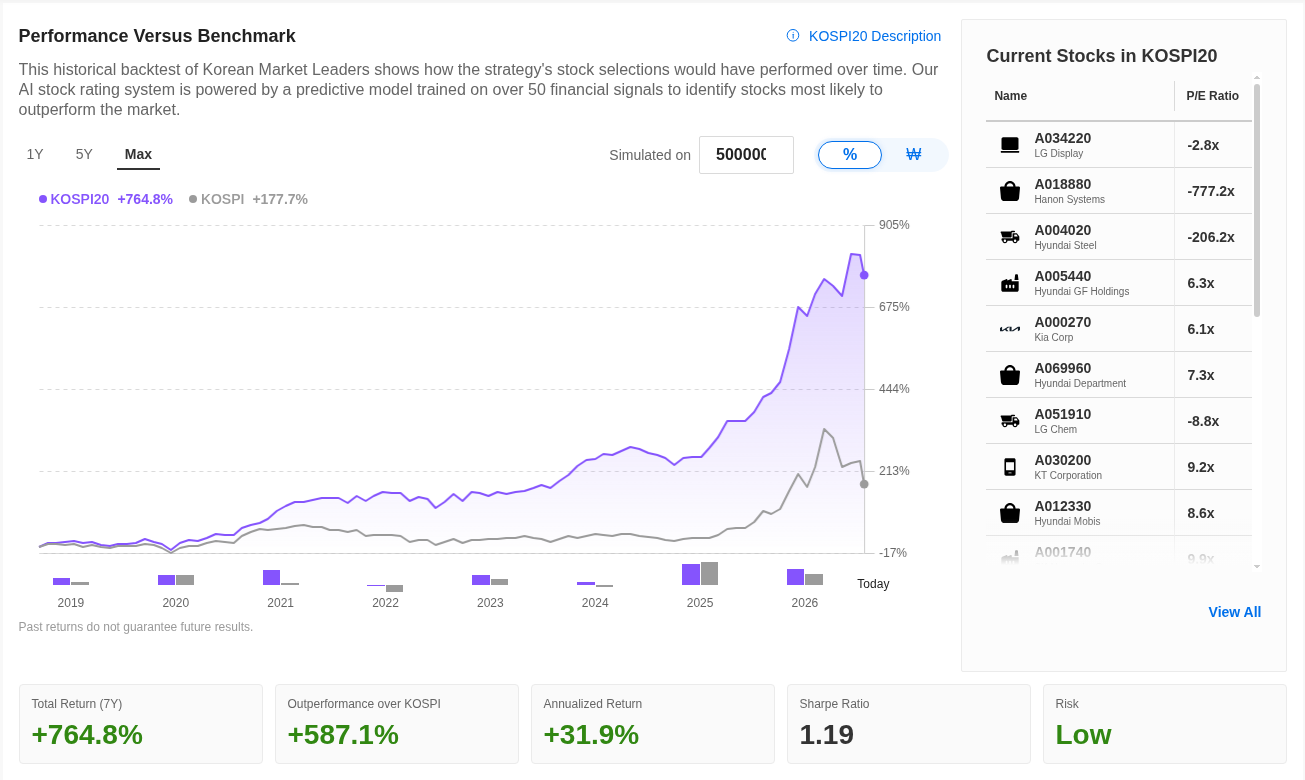
| Total return since Jan 1, 2019 (backtested) | KOSPI20 +764.8% vs KOSPI +177.7% |
| Annualized return (backtested) | +31.9% |
| Sharpe ratio | 1.19 |
| 1Y / 5Y return | +76.7% / +261.2% |
| 2026 YTD | +53.5% vs KOSPI +34.5% |
A note on context: the headline numbers are strong, but they are backtested results from January 1, 2019, not a track record of real money. Past performance, simulated or real, does not guarantee future results.
Added and Removed Stocks
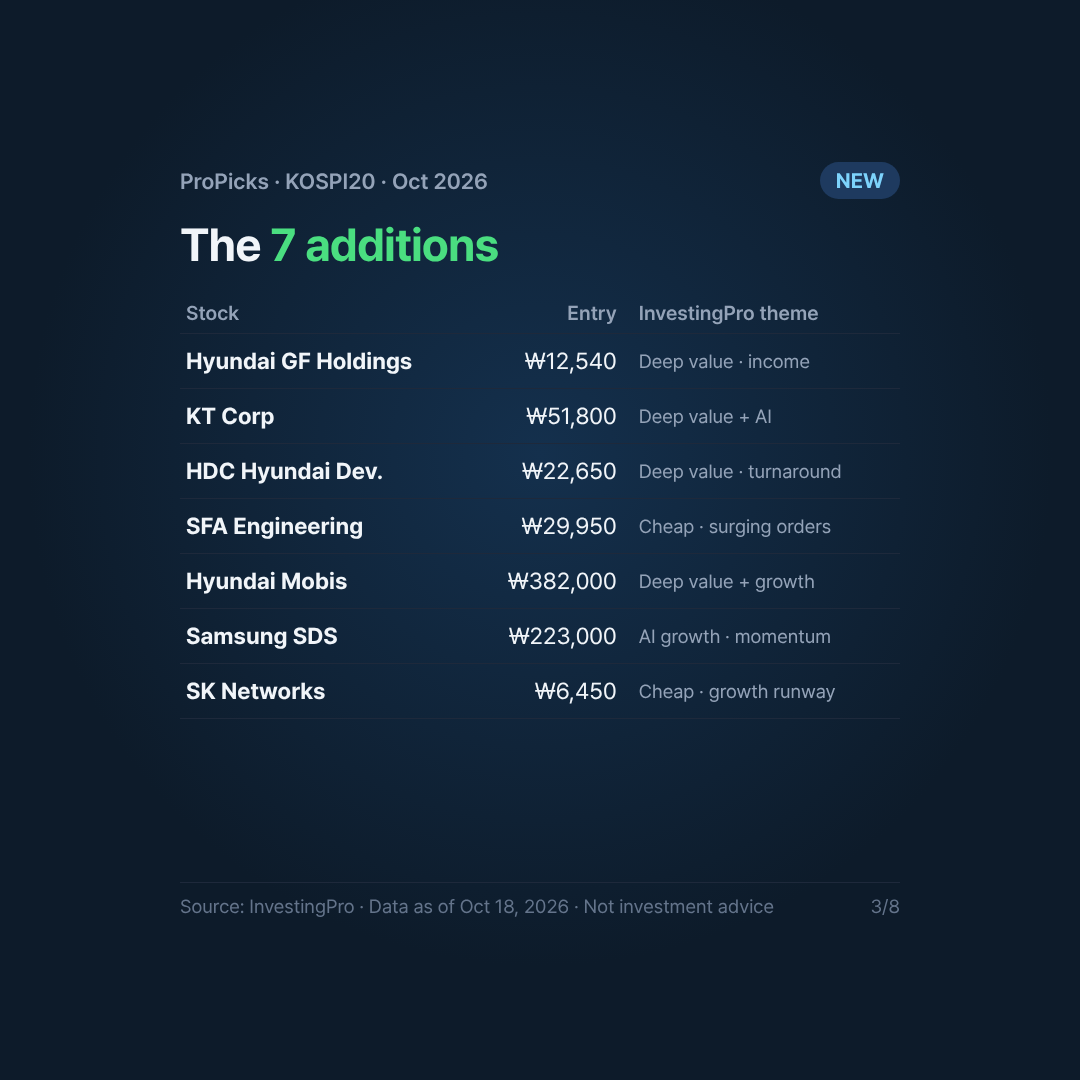
| Added (Oct 1) | Entry price | Oct 16 close | Change* | Selection theme |
|---|---|---|---|---|
| Hyundai GF Holdings | 12,540 | 12,420 | -1.0% | Deep Value, Strong Returns, Growing Income |
| KT Corporation | 51,800 | 50,400 | -2.7% | Deep Value Meets AI-Driven Growth |
| HDC Hyundai Development | 22,650 | 21,500 | -5.1% | Deep Value, Turnaround Momentum, Strengthening Balance Sheet |
| SFA Engineering | 29,950 | 27,700 | -7.5% | Cheap Stock, Surging Orders, AI Upside |
| Hyundai Mobis | 382,000 | 352,500 | -7.7% | Deep Value Meets Explosive Growth |
| Samsung SDS | 223,000 | 199,900 | -10.4% | AI Growth, Momentum, and Smart Partnerships |
| SK Networks | 6,450 | 5,700 | -11.6% | Cheap Stock, Big Growth Ahead |
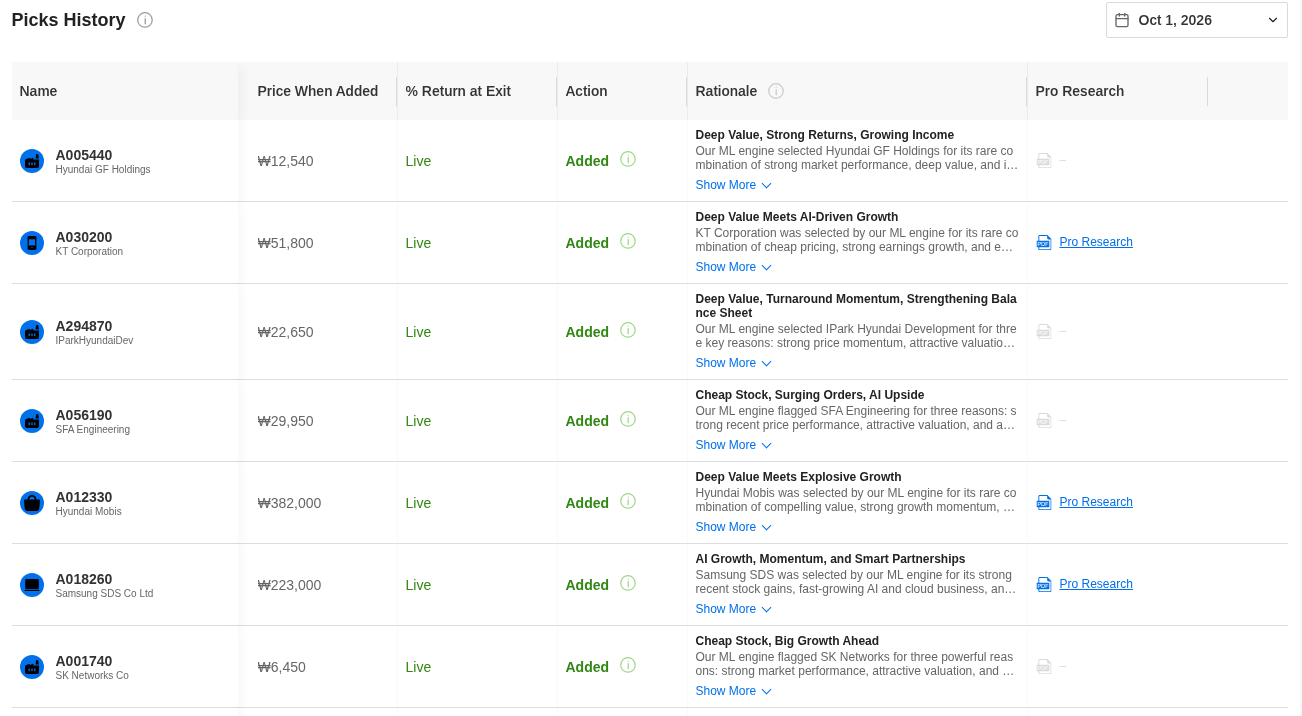
*Simple price change from the stated entry price to the Oct 16 close (the latest close in our Oct 18 data), computed by us. It excludes dividends and is not an official InvestingPro return figure.
All seven additions are trading below their entry prices after about two weeks. That is not a verdict on the picks. The strategy is built for monthly holding periods, and value names often take time to re-rate. Still, it is a reminder that a new entry is not a guaranteed short-term gain.
What Was Sold, and How It Played Out
| Removed (Oct 1) | Entry price | Return at Exit |
|---|---|---|
| Dongjin Semichem | 39,150 | +35.6% |
| S&S Tech | 40,850 | +27.5% |
| DN Automotive | 46,200 | +7.5% |
| LX International | 40,000 | +6.1% |
| People & Tech | 30,000 | +3.7% |
| Paradise | 10,210 | -7.1% |
| Kolon Industries | 69,532 | -20.8% |
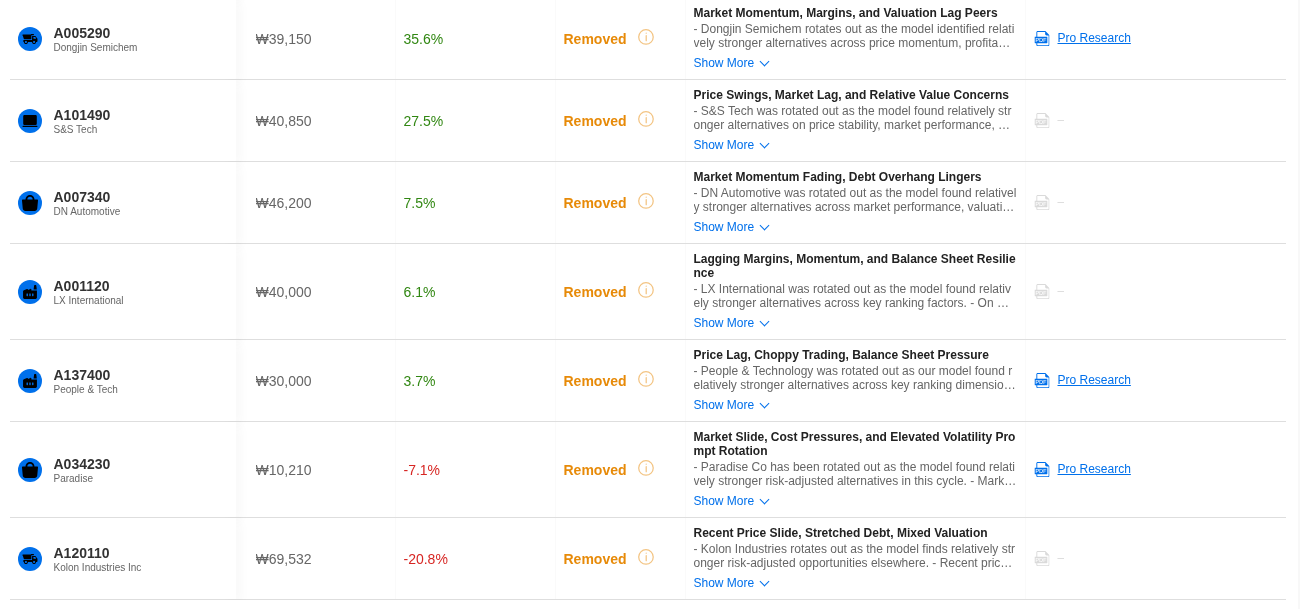
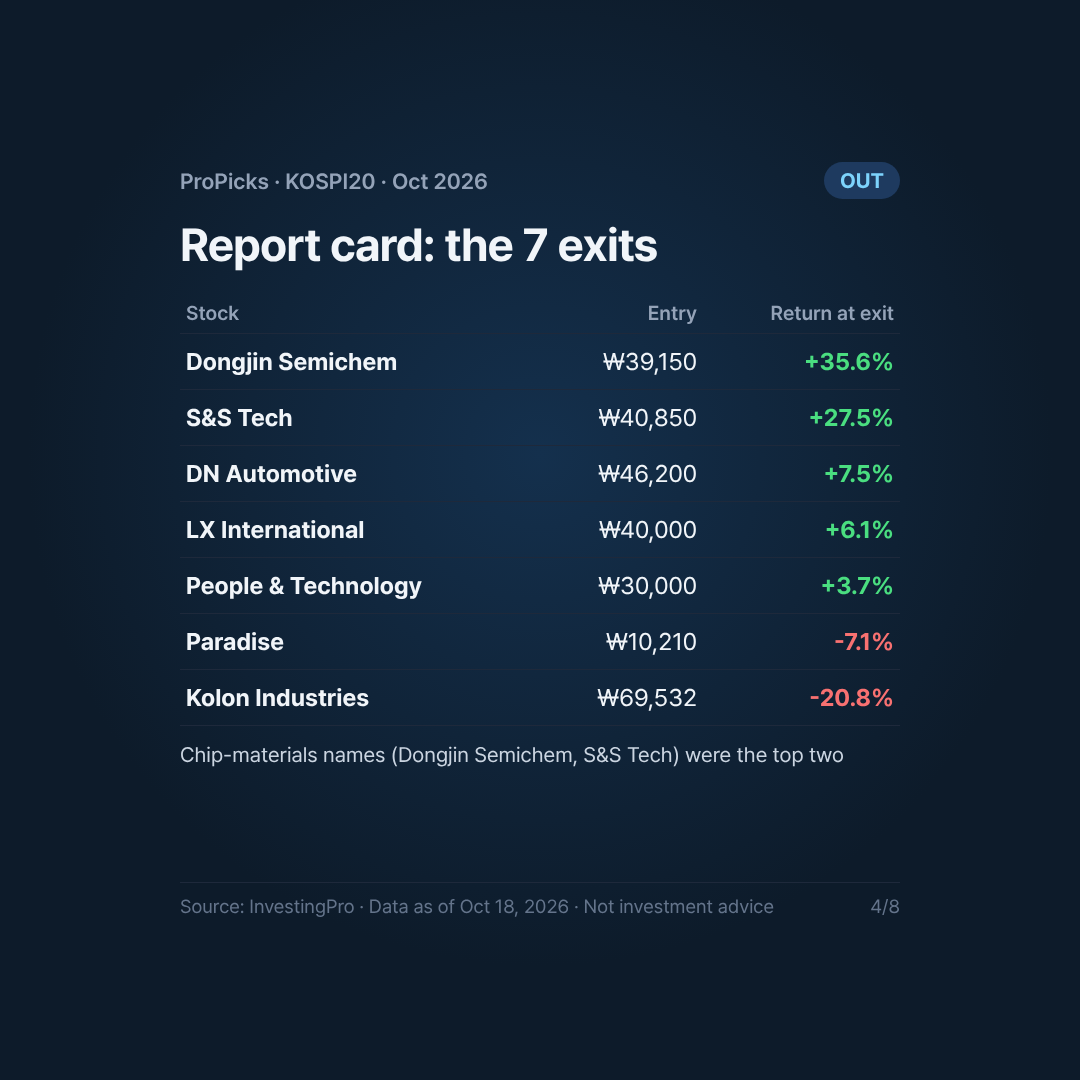
Five of the seven exits closed with gains, led by Dongjin Semichem (+35.6%) and S&S Tech (+27.5%), both semiconductor-supply-chain names. The simple average of the seven exit returns is about +7.5%. The two losers, Paradise (-7.1%) and Kolon Industries (-20.8%), show the other side of a rules-based system. It also cuts positions that are not working instead of waiting for a recovery.
Portfolio Characteristics After the Rebalance
Valuation: Average Fair Value Upside of 30.3%
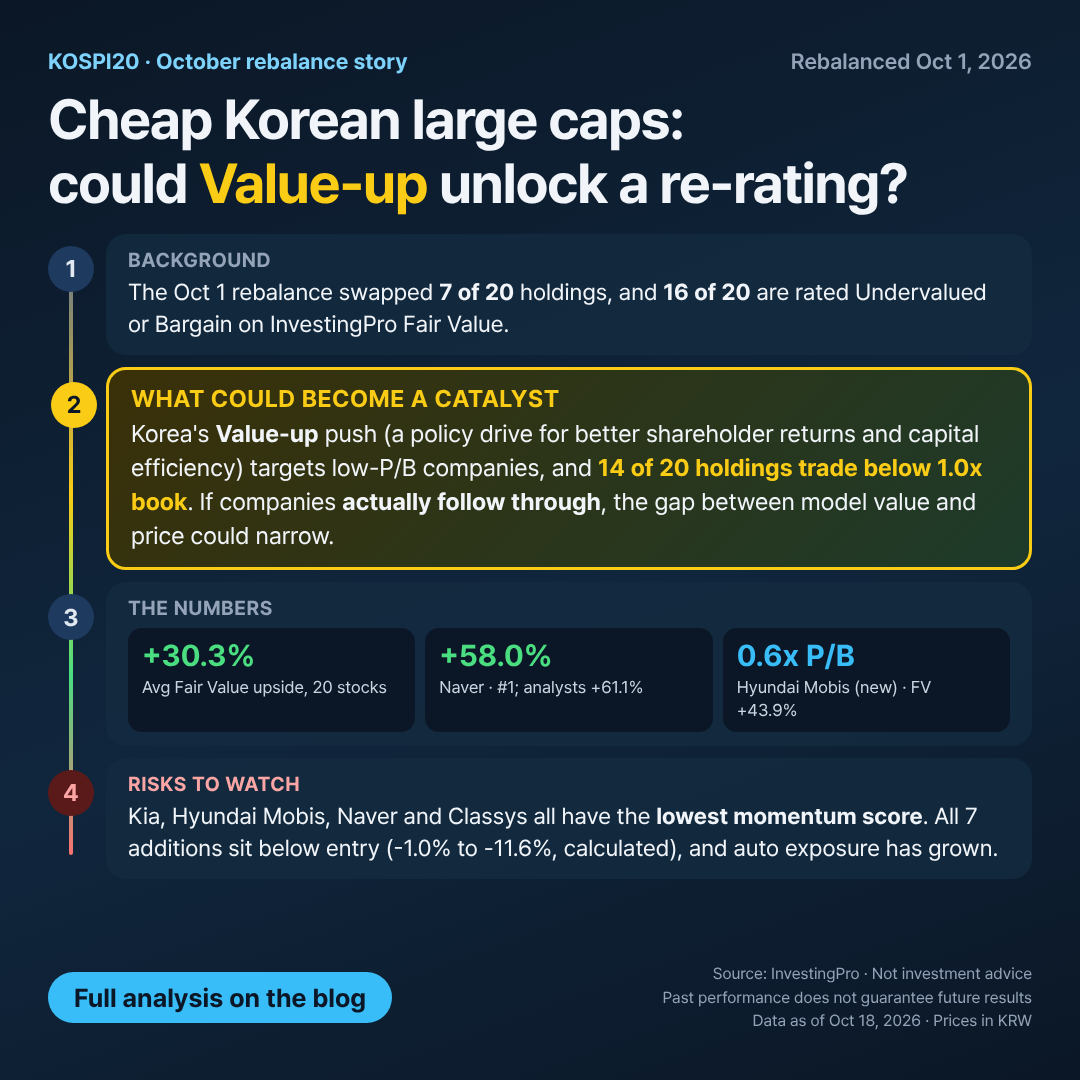
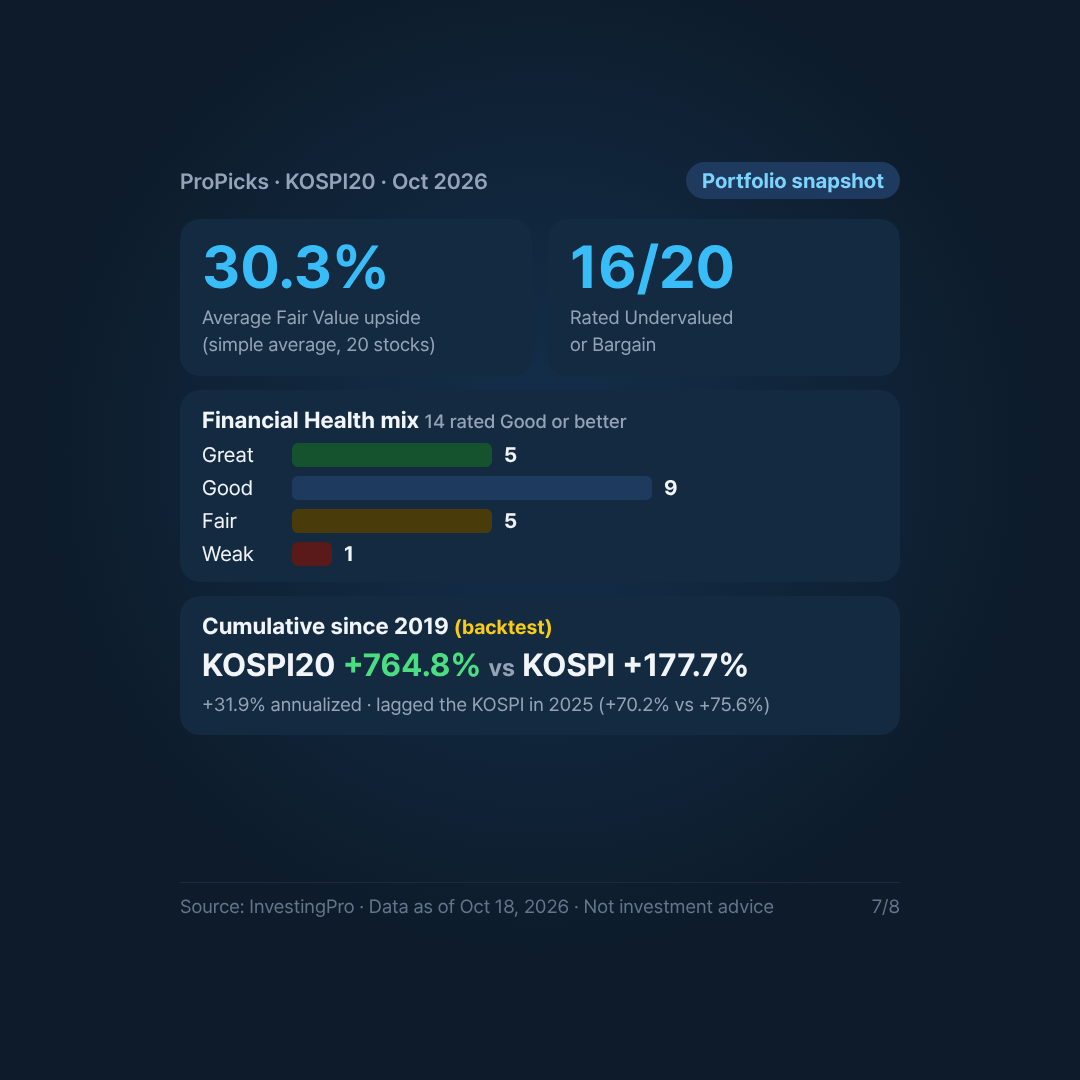
Across all 20 holdings, the average InvestingPro Fair Value upside is 30.3% (median 29.7%). The average analyst-target upside is notably higher, at 56.5% (median 52.9%). The gap is worth a closer look. Here, InvestingPro’s model-based Fair Value is the more conservative yardstick, and analyst targets can lag when prices fall quickly. A reasonable reading: treat Fair Value as the “base case” and the analyst figure as the “optimistic case”.
| Fair Value Label | Count | Holdings |
|---|---|---|
| Bargain | 2 | Naver, Classys |
| Undervalued | 14 | Kia, Hyundai Mobis, Hyundai GF Holdings, CS Wind, HL Mando, KT, Hanon Systems, HDC Hyundai Development, LG Display, Hyundai Department Store, Dongkook Pharmaceutical, SK Networks, SFA Engineering, Hyundai Steel |
| Fair | 4 | LG Chem, Lotte Shopping, LG CNS, Samsung SDS |
16 of 20 holdings are labelled Undervalued or Bargain. Only four sit at Fair, and one of those (Samsung SDS) was just added, which we discuss below.
Financial Health Distribution
| Health Label | Count | Holdings |
|---|---|---|
| Great | 5 | Kia, Hyundai GF Holdings, Dongkook Pharmaceutical, Classys, LG CNS |
| Good | 9 | Hyundai Mobis, KT, Naver, Samsung SDS, HL Mando, CS Wind, SFA Engineering, HDC Hyundai Development, Hyundai Department Store |
| Fair | 5 | LG Display, Hanon Systems, Hyundai Steel, SK Networks, Lotte Shopping |
| Weak | 1 | LG Chem |
70% of the portfolio (14 of 20) carries a Good or Great Health label. This matters because a value strategy’s biggest enemy is the “value trap”: a stock that is cheap because the business is deteriorating. A high share of Good/Great Health labels suggests the model is not simply buying the cheapest balance sheets in Korea. The flip side is the six Fair/Weak names, which we cover in the risk section.
Business Mix
InvestingPro’s data for this portfolio has no official sector labels. The grouping below is our own, based on widely known company descriptions. Treat it as a rough guide, not an official sector weighting.
| Business group | Holdings | Avg. FV upside |
|---|---|---|
| Autos, auto parts and steel | Kia, Hyundai Mobis, HL Mando, Hanon Systems, Hyundai Steel | 36.3% |
| IT services, internet platform and telecom | Samsung SDS, LG CNS, Naver, KT | 25.9% |
| Retail, consumer and holding companies | Hyundai GF Holdings, Hyundai Department Store, Lotte Shopping, SK Networks | 26.5% |
| Chemicals, displays, equipment and energy hardware | LG Chem, LG Display, SFA Engineering, CS Wind | 26.9% |
| Healthcare and medical aesthetics | Dongkook Pharmaceutical, Classys | 38.6% |
| Construction | HDC Hyundai Development | 31.1% |
Group averages computed by us from the InvestingPro Fair Value upside column (simple averages, not weighted by position size).
The portfolio leans toward the Hyundai automotive ecosystem (Kia, Hyundai Mobis, plus suppliers HL Mando and Hanon Systems, and Hyundai Steel), an IT services and AI angle (Samsung SDS, LG CNS, Naver, KT), and domestic consumption (department stores and retail). Notably absent: the large memory-chip makers. With Dongjin Semichem and S&S Tech gone, direct semiconductor exposure is thin. For the memory makers’ own valuations, see our SK Hynix fair value analysis and the Samsung Electronics section of our Fair Value Spotlight.
Full Holdings Table (sorted by Fair Value upside)
| Company | Price (KRW) | Fair Value | FV upside | FV label | Analyst target | Analyst upside | Health | P/E | P/B | Div. Yield | Debt/Cap |
|---|---|---|---|---|---|---|---|---|---|---|---|
| Naver | 180,000 | 284,358 | 58.0% | Bargain | 290,000 | 61.1% | Good | 13.5x | 0.9x | 1.5% | 16.5% |
| Classys | 27,600 | 41,578 | 50.6% | Bargain | 59,895 | 117.0% | Great | 13.1x | 3.3x | 3.7% | 7.6% |
| Kia | 110,200 | 163,933 | 48.8% | Undervalued | 196,226 | 78.1% | Great | 6.1x | 0.7x | 6.4% | 5.0% |
| Hyundai Mobis 🆕 | 352,500 | 507,104 | 43.9% | Undervalued | 641,500 | 82.0% | Good | 8.6x | 0.6x | 1.9% | 10.0% |
| Hyundai GF Holdings 🆕 | 12,420 | 17,411 | 40.2% | Undervalued | 19,000 | 53.0% | Great | 6.3x | 0.4x | 2.4% | 18.4% |
| CS Wind | 50,600 | 70,057 | 38.5% | Undervalued | 68,000 | 34.4% | Good | 486.7x | 1.6x | 2.0% | 36.3% |
| HL Mando | 40,950 | 56,467 | 37.9% | Undervalued | 67,423 | 64.6% | Good | 11.4x | 0.7x | 1.9% | 51.1% |
| KT Corporation 🆕 | 50,400 | 69,134 | 37.2% | Undervalued | 72,907 | 44.7% | Good | 9.2x | 0.6x | 4.8% | 47.8% |
| Hanon Systems | 3,835 | 5,086 | 32.6% | Undervalued | 4,558 | 18.9% | Fair | -777.2x | 1.0x | 0.0% | 48.1% |
| HDC Hyundai Development 🆕 | 21,500 | 28,178 | 31.1% | Undervalued | 30,000 | 39.5% | Good | 7.3x | 0.4x | 3.4% | 61.8% |
| LG Display | 7,490 | 9,608 | 28.3% | Undervalued | 12,026 | 60.6% | Fair | -2.8x | 0.6x | 0.0% | 72.5% |
| Hyundai Department Store | 79,200 | 101,424 | 28.1% | Undervalued | 159,778 | 101.7% | Good | 7.3x | 0.4x | 2.8% | 47.4% |
| Dongkook Pharmaceutical | 25,300 | 32,000 | 26.5% | Undervalued | 30,000 | 18.6% | Great | 14.9x | 1.6x | 0.8% | 5.1% |
| SK Networks 🆕 | 5,700 | 7,198 | 26.3% | Undervalued | 8,763 | 53.7% | Fair | 9.9x | 0.5x | 4.9% | 61.1% |
| SFA Engineering 🆕 | 27,700 | 34,421 | 24.3% | Undervalued | 34,800 | 25.6% | Good | 12.6x | 0.8x | 3.3% | 12.5% |
| Hyundai Steel | 28,500 | 33,718 | 18.3% | Undervalued | 41,587 | 45.9% | Fair | -206.2x | 0.2x | 1.8% | 72.0% |
| LG Chem | 254,000 | 295,557 | 16.4% | Fair | 384,217 | 51.3% | Weak | -8.8x | 0.5x | 0.8% | 55.6% |
| Lotte Shopping | 85,300 | 95,060 | 11.4% | Fair | 162,000 | 89.9% | Fair | 13.3x | 0.2x | 5.0% | 77.1% |
| LG CNS | 65,200 | 70,959 | 8.8% | Fair | 99,538 | 52.7% | Great | 13.1x | 2.1x | 3.0% | 8.3% |
| Samsung SDS 🆕 | 199,900 | 199,062 | -0.4% | Fair | 273,353 | 36.7% | Good | 23.8x | 1.5x | 1.6% | 10.9% |
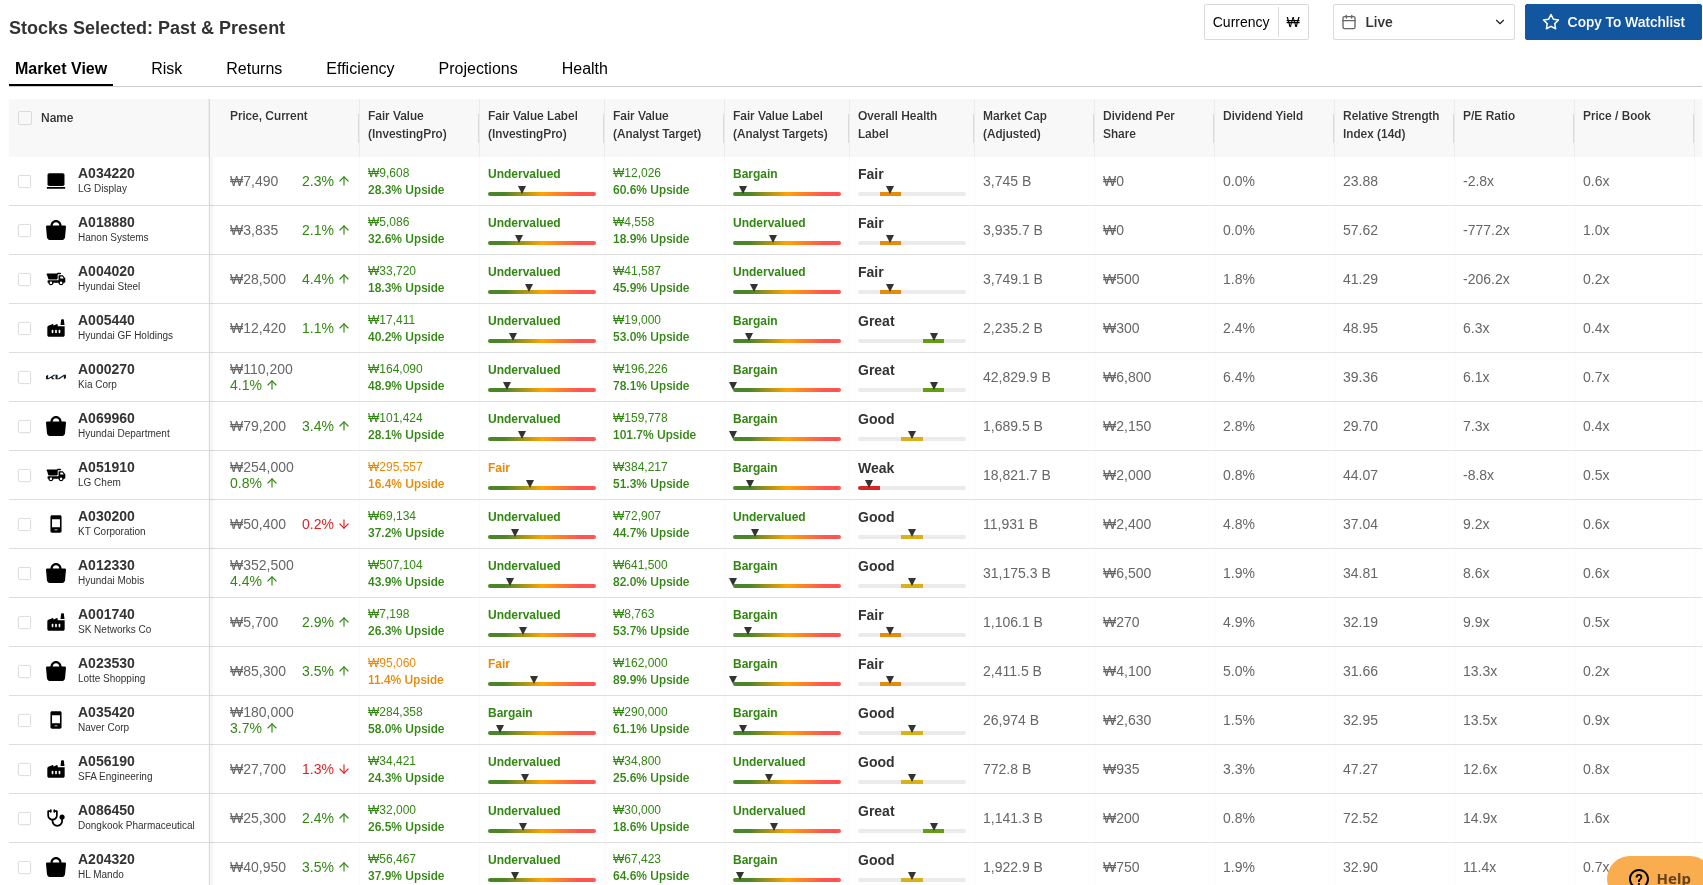
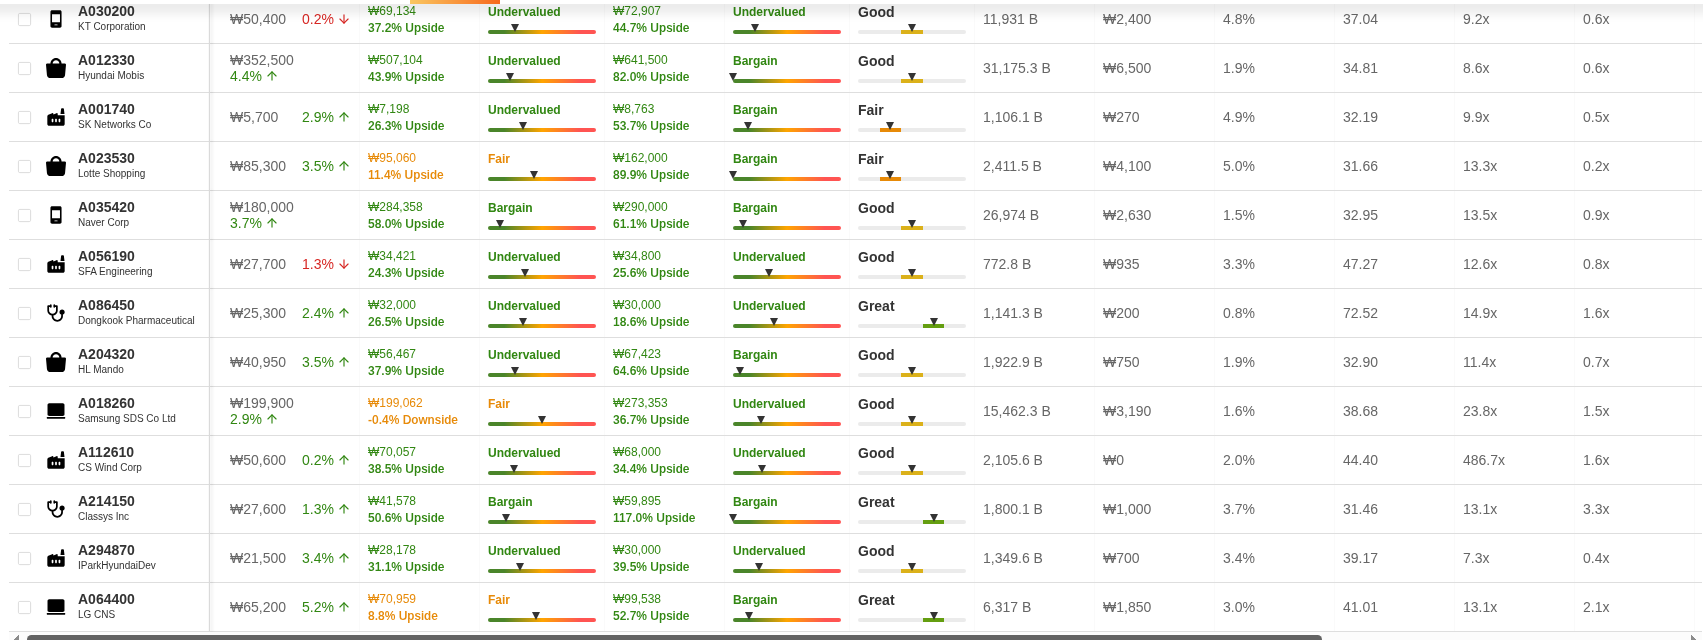
🆕 = added Oct 1, 2026. Data as of Oct 18, 2026.
Featured Stocks: Deep Dive
A pattern across the five featured names: on InvestingPro’s Health cards, Price Momentum is the weakest score for Kia, Hyundai Mobis, Naver and Classys, while their cash flow and profitability scores are mid-range or better. That is what a value-tilted model buying out-of-favour stocks should look like. It is also why patience, and tolerance for drawdowns, is part of the deal.
1. Kia: The Highest-Yielding Value Name in the Portfolio
| Metric | Value |
|---|---|
| Price | 110,200 KRW |
| InvestingPro Fair Value | 163,933 KRW (+48.8%, Undervalued) |
| Analyst target | 196,226 KRW (+78.1%) |
| Health | Great |
| P/E / P/B | 6.1x / 0.7x |
| Dividend yield | 6.4% (DPS 6,800 KRW) |
| Debt/Cap | 5.0% |
| From 52-week high / YTD | -48.1% / -5.6% |
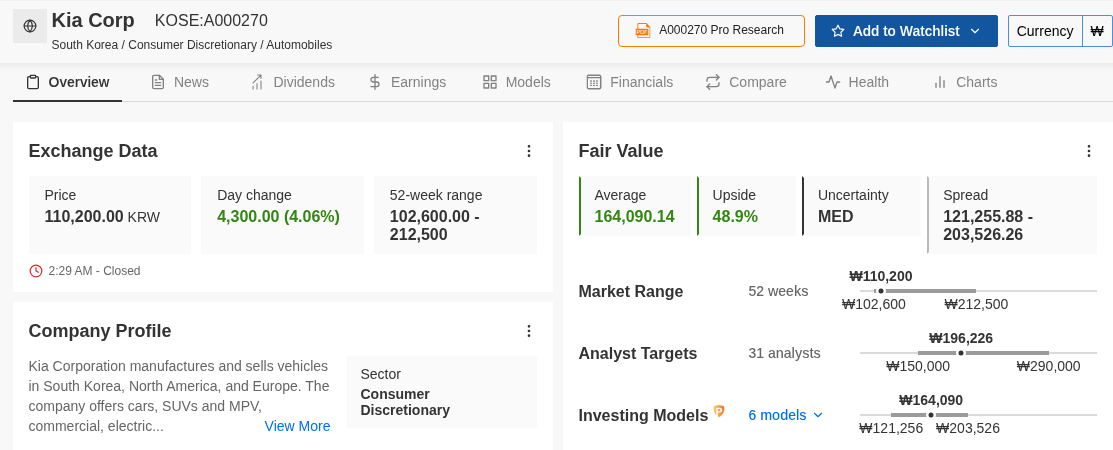
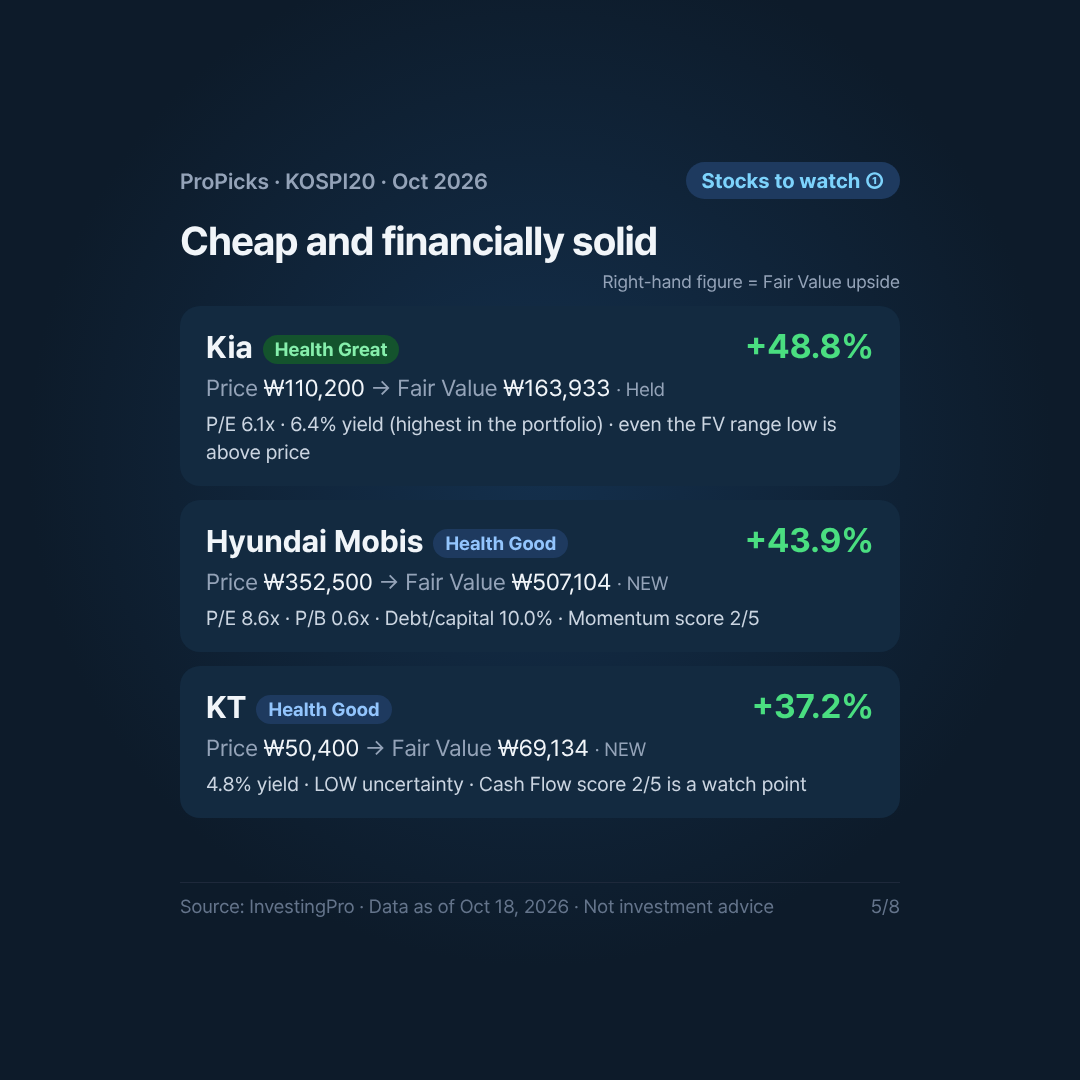
Kia offers three things value investors look for: a single-digit P/E (6.1x), a price below book value (0.7x P/B), and a 6.4% dividend yield, the highest in the portfolio. Its Debt/Cap of 5.0% and Great Health label suggest that dividend is not being funded by leverage. The 48.8% Fair Value upside is among the largest in the portfolio.
Why is it this cheap? The stock is 48.1% below its 52-week high and down 5.6% YTD, so the market is clearly pricing in concerns. The usual ones are tariffs, the auto cycle and currency. The numbers say the valuation already reflects a lot of pessimism. They do not say when, or whether, that will reverse.
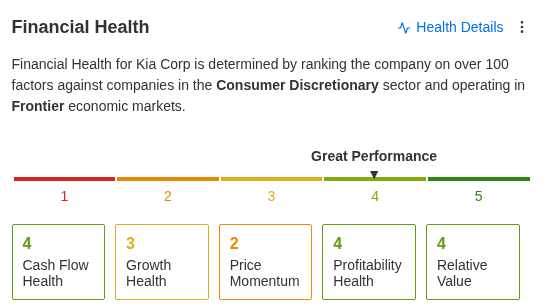
Health breakdown (1 to 5): Cash Flow 4, Growth 3, Price Momentum 2, Profitability 4, Relative Value 4. The Great label rests on cash generation, profitability and valuation. The one soft spot is Price Momentum (2), which simply reflects the drawdown. Fair Value uncertainty is MED, and the model range runs from 121,256 to 203,526 KRW. Notably, even the low end of that range sits about 10% above the current price. The 31 analysts’ targets span 150,000 to 290,000 KRW. Even the most cautious target is about 36% above today’s price. That is a strong cushion on paper, but ranges are model outputs, not floors.
2. Hyundai Mobis (New): Deep Value in the Parts Business
| Metric | Value |
|---|---|
| Price | 352,500 KRW (entry 382,000) |
| InvestingPro Fair Value | 507,104 KRW (+43.9%, Undervalued) |
| Analyst target | 641,500 KRW (+82.0%) |
| Health | Good |
| P/E / P/B | 8.6x / 0.6x |
| Dividend yield | 1.9% |
| Debt/Cap | 10.0% |
| Selection theme | Deep Value Meets Explosive Growth |
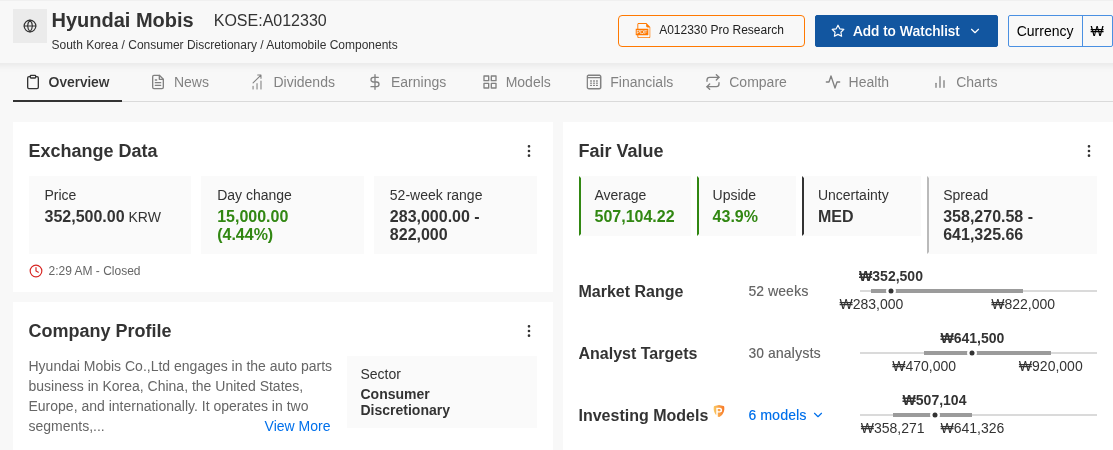
Hyundai Mobis, the Hyundai Motor Group’s core parts and modules supplier, comes in with the theme “Deep Value Meets Explosive Growth.” At 8.6x earnings and 0.6x book, with a low 10.0% Debt/Cap, it screens cheaply on every multiple in our data. InvestingPro’s Fair Value implies 43.9% upside, and the analyst consensus is even more bullish at +82.0%.
It has already slipped about 7.7% below its entry price and sits 57.1% under its 52-week high. Together with Kia, HL Mando and Hanon Systems, it adds to the portfolio’s auto supply-chain concentration. That is worth knowing, but it is not by itself a reason to avoid the stock.
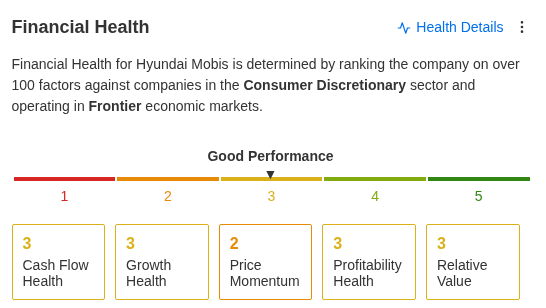
Health breakdown (1 to 5): Cash Flow 3, Growth 3, Price Momentum 2, Profitability 3, Relative Value 3, with MED Fair Value uncertainty. It is a balanced, middle-of-the-road profile: no single fundamental standout, and Price Momentum is the weakest pillar. Note that the “Explosive Growth” theme is not matched by a high Growth score (3). The case leans more on valuation than on the Health card.
3. KT Corporation (New): Telecom Yield With an AI Story
| Metric | Value |
|---|---|
| Price | 50,400 KRW (entry 51,800) |
| InvestingPro Fair Value | 69,134 KRW (+37.2%, Undervalued) |
| Analyst target | 72,907 KRW (+44.7%) |
| Health | Good |
| P/E / P/B | 9.2x / 0.6x |
| Dividend yield | 4.8% |
| Debt/Cap | 47.8% |
| Selection theme | Deep Value Meets AI-Driven Growth |
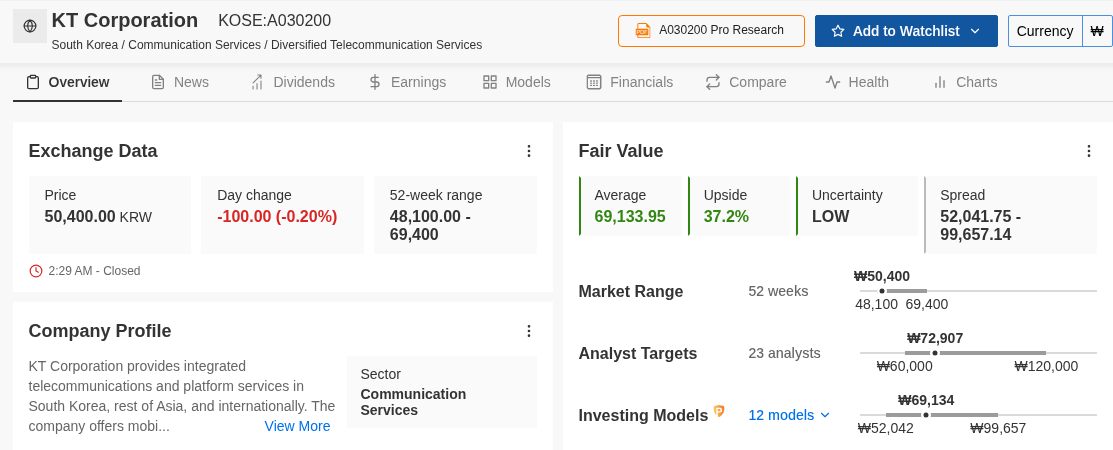
KT, one of Korea’s major telecom carriers, is tagged “Deep Value Meets AI-Driven Growth.” On the numbers, the case is defensive: a 4.8% dividend yield, a P/E of 9.2x, and a P/B of 0.6x. Its longer-term returns are also strong (3Y +79.5%, 5Y +114.7%), unlike many deep-value names in the list.
The trade-off is leverage: Debt/Cap is 47.8%, typical for a capital-intensive telecom but much higher than Kia or Mobis. The “AI-driven growth” part of the theme is InvestingPro’s framing. Our data does not measure it, so we treat it as a thesis to watch, not a fact.
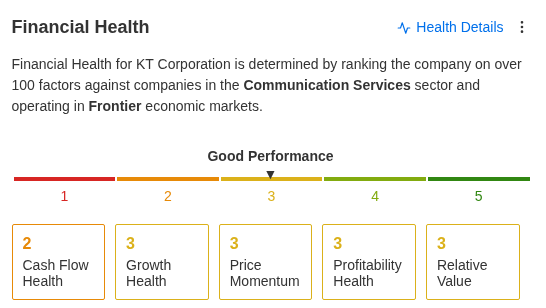
Health breakdown (1 to 5): Cash Flow 2, Growth 3, Price Momentum 3, Profitability 3, Relative Value 3, with LOW Fair Value uncertainty, the only LOW among the five featured stocks. LOW uncertainty means InvestingPro’s valuation models agree more closely. That makes the 37.2% upside estimate relatively robust. The weakest pillar is Cash Flow (2). That is worth watching, since part of the appeal is a 4.8% dividend and Debt/Cap is 47.8%. KT is also the only featured stock where Price Momentum is not the weakest score. The model spread runs from 52,041.75 to 99,657.14 KRW. Even the low end is about 3% above today’s 50,400 KRW, which fits the LOW uncertainty rating.
4. Naver: The Largest Discount to Fair Value
| Metric | Value |
|---|---|
| Price | 180,000 KRW |
| InvestingPro Fair Value | 284,358 KRW (+58.0%, Bargain) |
| Analyst target | 290,000 KRW (+61.1%) |
| Health | Good |
| P/E / P/B / P/S | 13.5x / 0.9x / 2.1x |
| Dividend yield | 1.5% |
| Debt/Cap | 16.5% |
| YTD / 1Y | -25.0% / -28.8% |
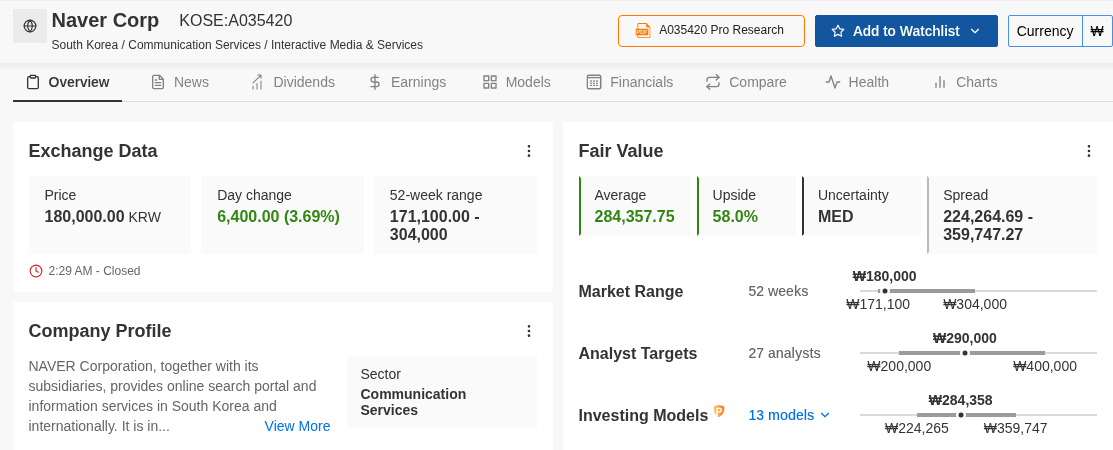
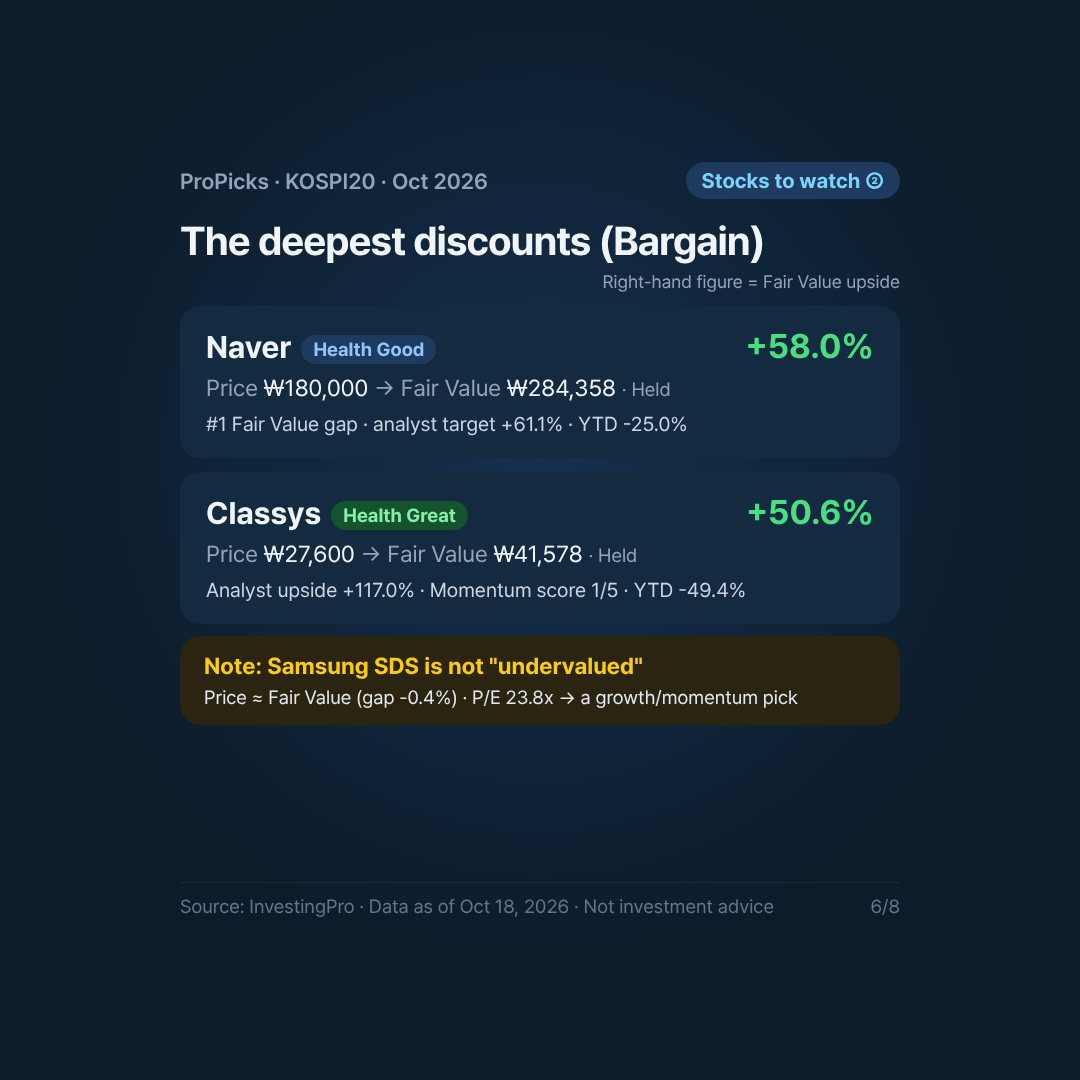
Naver, Korea’s leading search and internet platform, has the largest Fair Value upside in the portfolio (58.0%) and is one of only two stocks labelled Bargain. The analyst target (+61.1%) is very close to the Fair Value estimate, which is a useful sign of agreement between model and Street.
The price action, however, has been poor: -25.0% YTD and -28.8% over one year. That is the classic contrarian setup: valuation looks compelling because sentiment is weak. The Good Health label and modest 16.5% Debt/Cap help. But nothing in this data tells us what will close the gap.
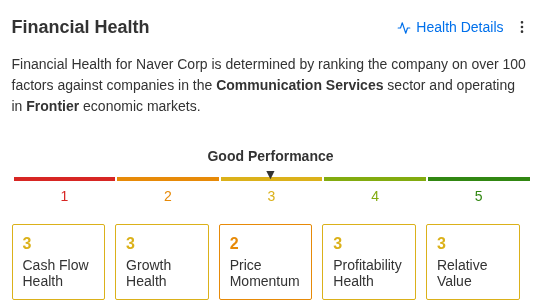
Health breakdown (1 to 5): Cash Flow 3, Growth 3, Price Momentum 2, Profitability 3, Relative Value 3, with MED uncertainty. The profile is identical to Hyundai Mobis: steady mid-range fundamentals with Price Momentum lagging. In other words, the Bargain label comes from the gap between price and modeled value, not from standout scores on the Health card.
5. Classys: Highest Analyst Upside, Hardest Drawdown
| Metric | Value |
|---|---|
| Price | 27,600 KRW |
| InvestingPro Fair Value | 41,578 KRW (+50.6%, Bargain) |
| Analyst target | 59,895 KRW (+117.0%) |
| Health | Great |
| P/E / P/B / P/S | 13.1x / 3.3x / 4.9x |
| Dividend yield | 3.7% |
| Debt/Cap | 7.6% |
| From 52-week high / YTD | -64.4% / -49.4% |
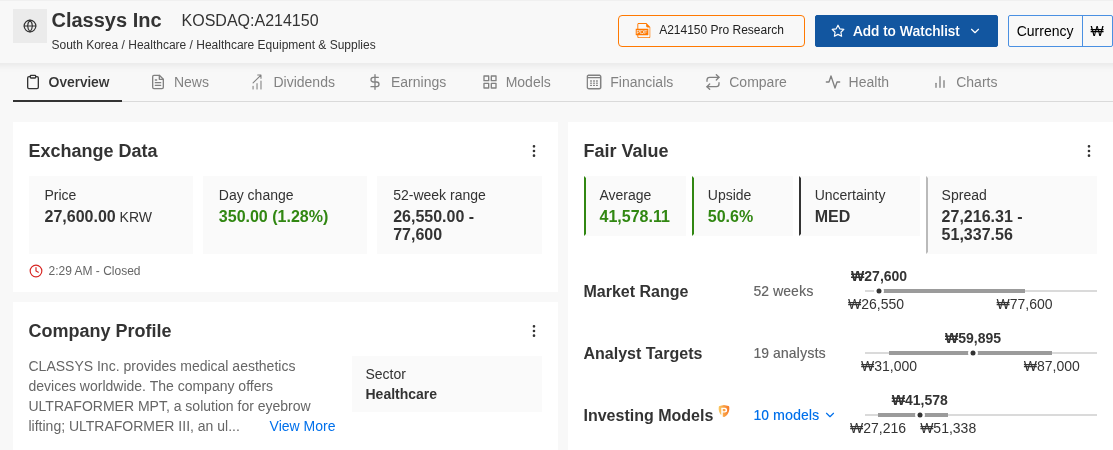
Classys, a maker of aesthetic medical devices, has both a Great Health label and the highest analyst-target upside in the portfolio (+117.0%). It also carries a Bargain Fair Value label (+50.6%). Unlike most holdings, it is not cheap on book value (3.3x P/B, 4.9x P/S). That reflects a higher-margin, asset-light business.
The warning sign is momentum: the stock is down 49.4% YTD and 64.4% from its 52-week high. After a drawdown that deep, a large gap to analyst targets can mean opportunity. Or it can mean targets have not caught up with a changed outlook. Position-sizing discipline matters more here than for a name like Kia.
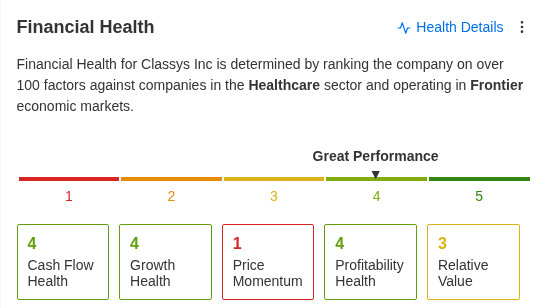
Health breakdown (1 to 5): Cash Flow 4, Growth 4, Price Momentum 1, Profitability 4, Relative Value 3, with MED uncertainty. This is the starkest split in the portfolio: top-tier cash flow, growth and profitability scores alongside the lowest possible Price Momentum score (1). Fundamentals and the share price are telling very different stories. Relative Value at 3 (not 4 or 5) also fits the higher P/B noted above.
Honest Note: Samsung SDS Was Added at Fair Value
| Metric | Value |
|---|---|
| Price | 199,900 KRW (entry 223,000) |
| InvestingPro Fair Value | 199,062 KRW (-0.4%, Fair) |
| Analyst target | 273,353 KRW (+36.7%) |
| Health | Good |
| P/E / P/B | 23.8x / 1.5x |
| Selection theme | AI Growth, Momentum, and Smart Partnerships |
Samsung SDS is the one new addition that does not fit the “deep value” pattern. Its price is essentially at InvestingPro’s Fair Value (-0.4%). Its P/E of 23.8x is the highest among holdings with normal positive earnings (CS Wind’s 486.7x is distorted by very low earnings). The selection theme, “AI Growth, Momentum, and Smart Partnerships,” tells you why it is in: this is a growth and momentum pick, not a valuation pick.
That is a fair choice for a diversified strategy. But readers should not assume every ProPicks addition is “undervalued.” Analysts see +36.7% upside, so the bull case rests on growth expectations rather than on current Fair Value. It is also the second-worst performer of the new additions since entry (-10.4%).
Risks and Caveats
Weak and Fair Health Names
- LG Chem is the only Weak Health holding, with a negative P/E (-8.8x) and 55.6% Debt/Cap. Its Fair Value upside (16.4%) is below the portfolio average. Its inclusion likely rests on a deep book-value discount (0.5x P/B) and wide analyst upside (+51.3%).
- Five holdings are rated Fair: LG Display, Hanon Systems, Hyundai Steel, SK Networks and Lotte Shopping.
Negative or Distorted Earnings
- Negative P/E: LG Display (-2.8x), Hanon Systems (-777.2x), Hyundai Steel (-206.2x) and LG Chem (-8.8x). Four of 20 holdings are loss-making on a trailing basis. Their valuations rely on book value and recovery expectations.
- CS Wind’s 486.7x P/E reflects very thin trailing earnings; P/E is not a meaningful yardstick for it right now.
Leverage
- Debt/Cap above 60%: Lotte Shopping (77.1%), LG Display (72.5%), Hyundai Steel (72.0%), HDC Hyundai Development (61.8%), SK Networks (61.1%). High leverage amplifies both recovery and downside, and makes these names more sensitive to interest rates.
Drawdowns From 52-Week Highs
- 13 of 20 holdings trade 40% or more below their 52-week high, and the average holding is about 44.5% below. This fits a value strategy that buys beaten-down names. It also shows how volatile Korean large caps have been.
- On the other side, Dongkook Pharmaceutical has an RSI(14) of 72.5, above the commonly used 70 “overbought” threshold, after a +31.6% gain since it was added on June 1, 2026.
Backtest Caveats
- Performance since 2019 is backtested. Backtests benefit from hindsight in model design and generally do not capture slippage, taxes, or real-world execution.
- The strategy did not beat the KOSPI every year: in 2025 it returned +70.2% against the KOSPI’s +75.6%.
- Monthly turnover (7 of 20 names this month) can create transaction costs and tax implications that a backtest does not show.
Yearly Performance: KOSPI20 vs KOSPI (Backtested)
| Year | KOSPI20 (backtested) | KOSPI | Difference (pp) |
|---|---|---|---|
| 2019 | +23.3% | +7.7% | +15.6 |
| 2020 | +31.9% | +30.8% | +1.1 |
| 2021 | +49.6% | +3.6% | +46.0 |
| 2022 | -5.6% | -24.9% | +19.3 |
| 2023 | +31.8% | +18.7% | +13.1 |
| 2024 | +9.4% | -9.6% | +19.0 |
| 2025 | +70.2% | +75.6% | -5.4 |
| 2026 YTD | +53.5% | +34.5% | +19.0 |
The most informative years are the down years. In 2022, KOSPI20 fell 5.6% while the KOSPI fell 24.9%, and in 2024 it gained 9.4% while the index lost 9.6%. Downside resilience, rather than the headline +764.8%, is arguably the more relevant feature for a strategy labelled “Low” risk. Still, these are simulated results.
A Korea-Specific Lens
- Currency: For non-KRW investors, returns depend on the won exchange rate as well as share prices. A weaker won can erode returns for foreign holders even when local prices rise. Exporters like Kia and Hyundai Mobis are also sensitive to FX moves.
- Liquidity: Several holdings are much smaller than Kia or Naver (for example SFA Engineering at about 773 billion KRW market cap and SK Networks at about 1.1 trillion KRW). Smaller names can have wider spreads and larger price swings.
- Korea Value-up program: Korea’s corporate Value-up initiative aims to address the long-standing “Korea discount” by encouraging better shareholder returns and capital efficiency. Here, 14 of 20 holdings trade below 1.0x P/B, exactly the profile the policy targets. Whether companies follow through is the key uncertainty.
- Global access: Korean shares are not as easy to buy from every country as US stocks; check your broker’s market access, fees and tax treatment.
Conclusion
The October 2026 rebalance pushed KOSPI20 further into value territory: a 30.3% average Fair Value upside, 16 of 20 holdings labelled Undervalued or Bargain, and 14 of 20 with Good or Great Health. The new additions, led by Hyundai Mobis and KT, lean on deep value with a growth twist. Samsung SDS is a deliberate momentum exception. Exits locked in gains on Dongjin Semichem and S&S Tech.
The risks are equally visible: a Weak Health holding (LG Chem), four loss-making names, five highly leveraged balance sheets, steep drawdowns, and performance figures that are backtested. This review is a way to understand what the model is doing and why, not a list of stocks to buy. We will revisit after the next rebalance on November 1, 2026.
Disclaimer: This content is an analysis based on InvestingPro data and is not investment advice or a recommendation to buy or sell any security. Past performance does not guarantee future results.
Data as of October 18, 2026. Strategy performance figures are backtested.