Summary
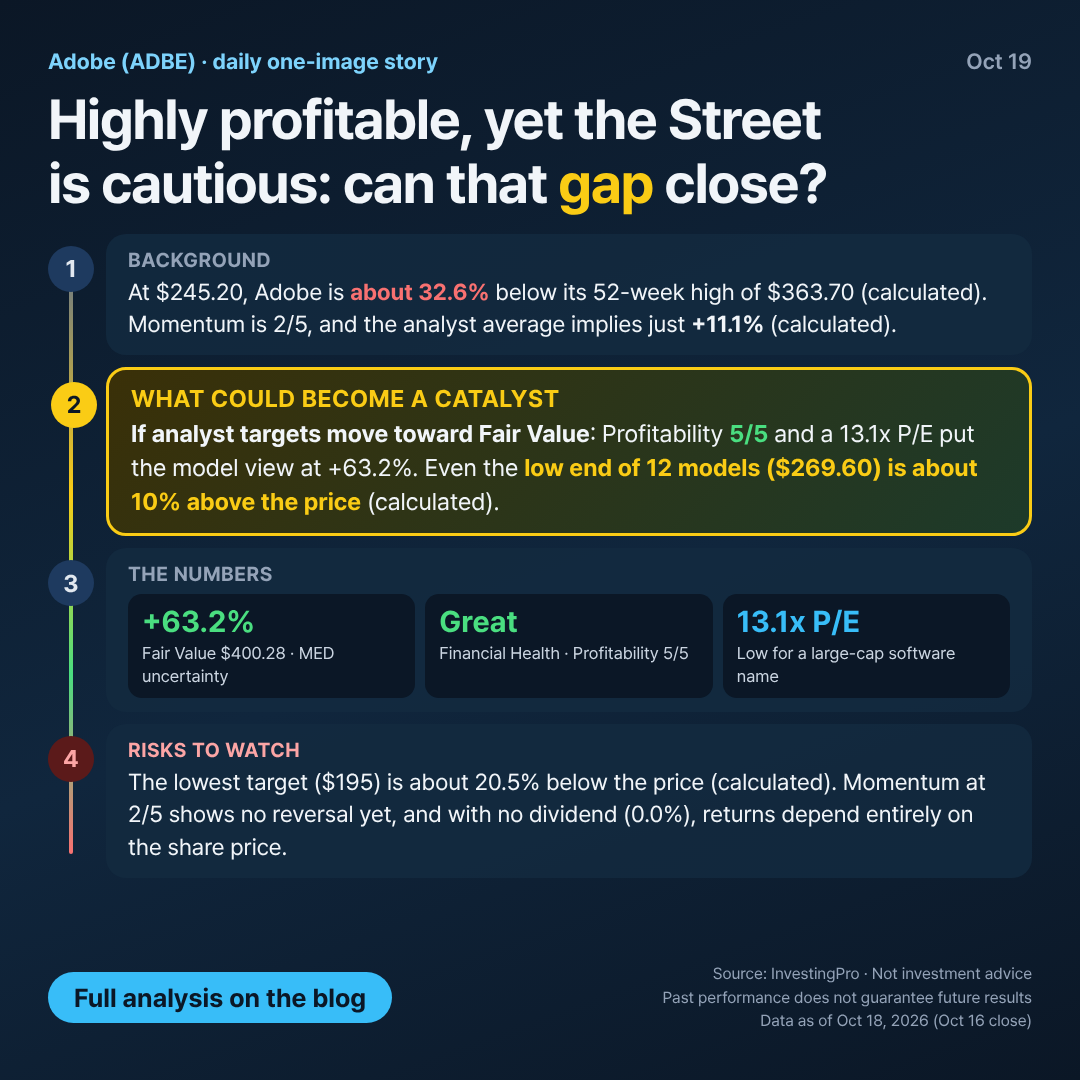
Adobe $245.20 · Fair Value $400.28 (+63.2%) · Financial Health: Great (uncertainty: MED)
Business Overview
Adobe is a software company best known for its creative tools (Photoshop, Illustrator) and PDF/Acrobat. Its Digital Media segment helps individuals, teams and enterprises create and manage content. It trades on the NASDAQ and has a market cap of $95.432B.
Valuation: Fair Value vs. Analyst Targets
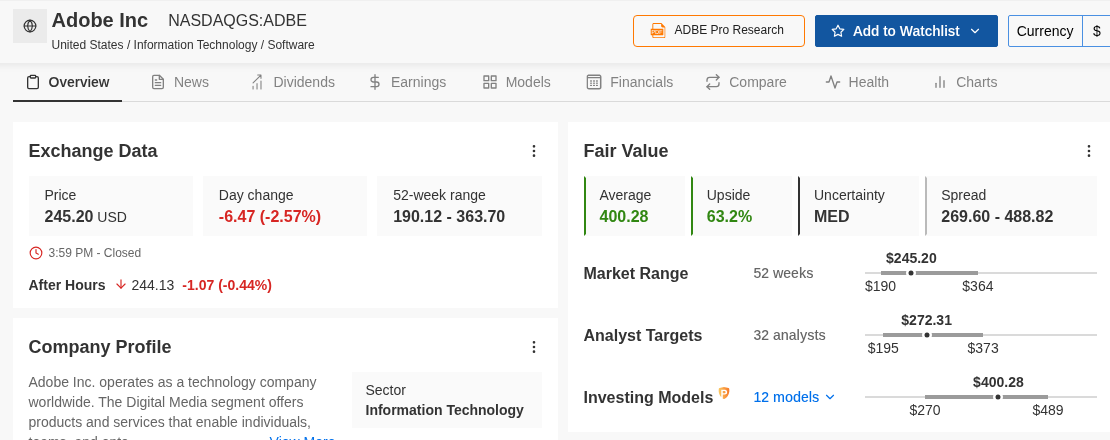
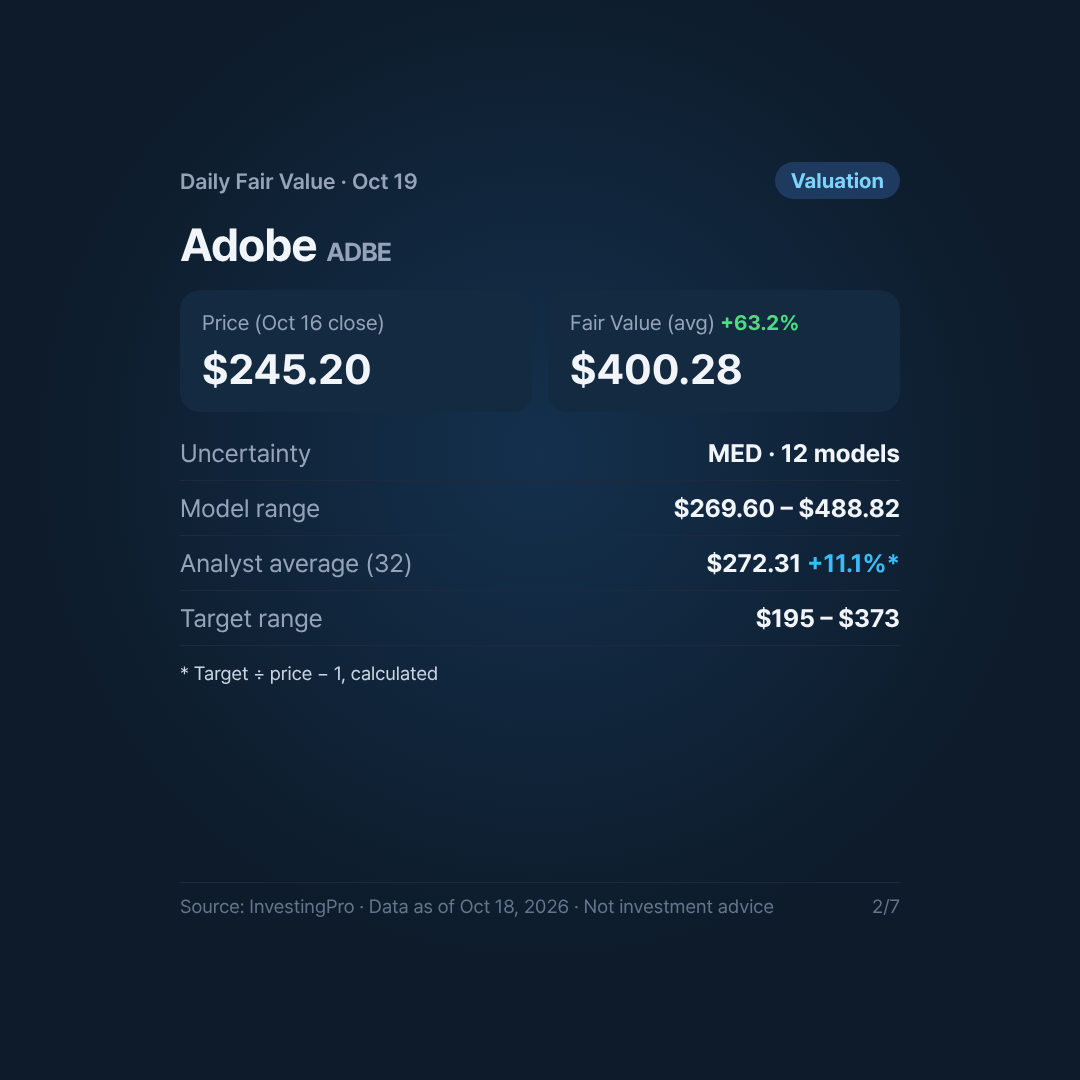
| Metric | Value |
|---|---|
| Price (Oct 16 close) | $245.20 |
| Fair Value average | $400.28 (+63.2%) |
| Uncertainty | MED |
| Model spread (12 models) | $269.60 to $488.82 |
| Analyst average (32 analysts) | $272.31 (+11.1%, calculated) |
| Analyst target range | $195 to $373 |
| P/E / Dividend yield | 13.1x / 0.0% |
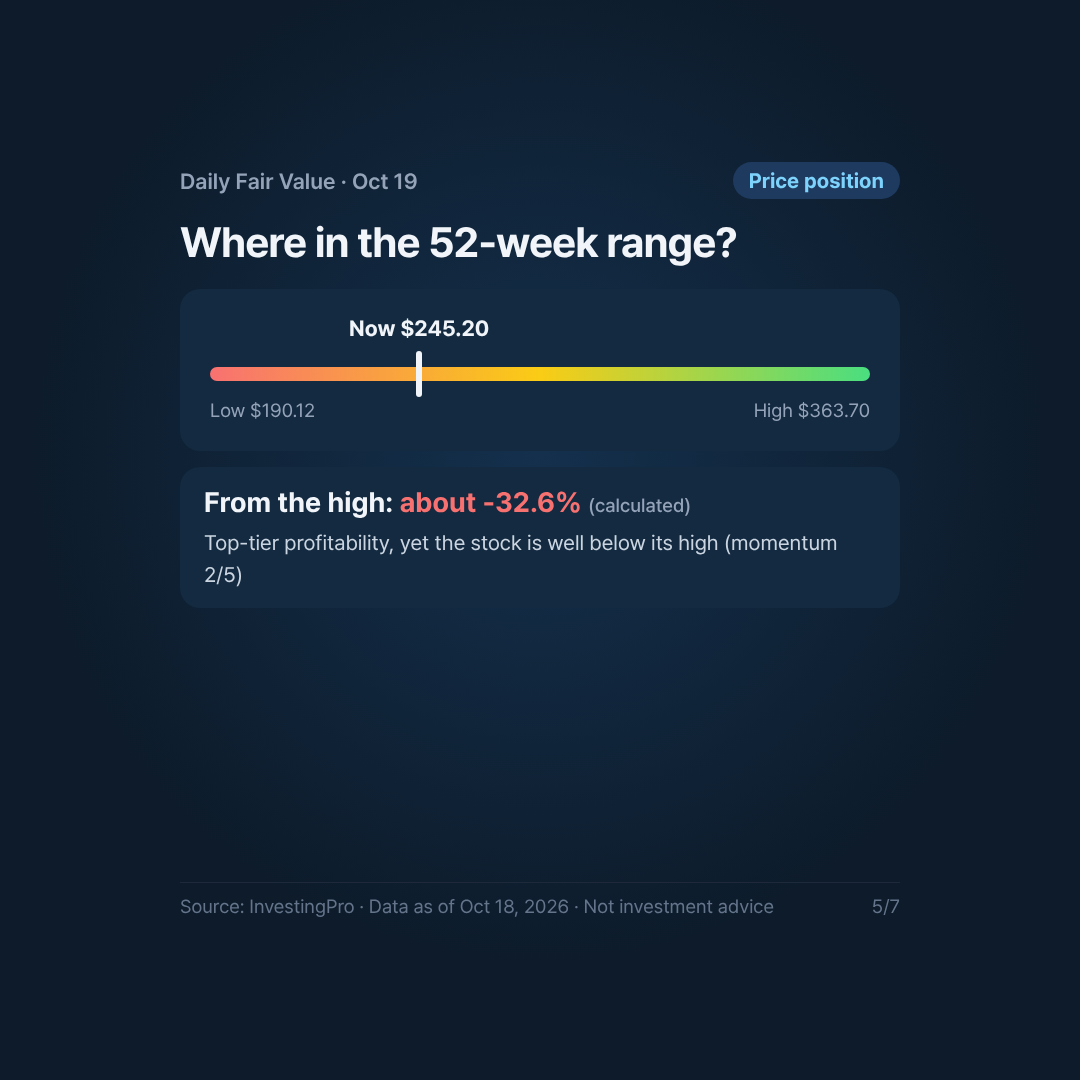
| 52-week range | $190.12 to $363.70 |
Analyst upside is calculated as average target ÷ price − 1; it is not displayed by InvestingPro.
Even the low end of the models is above the price
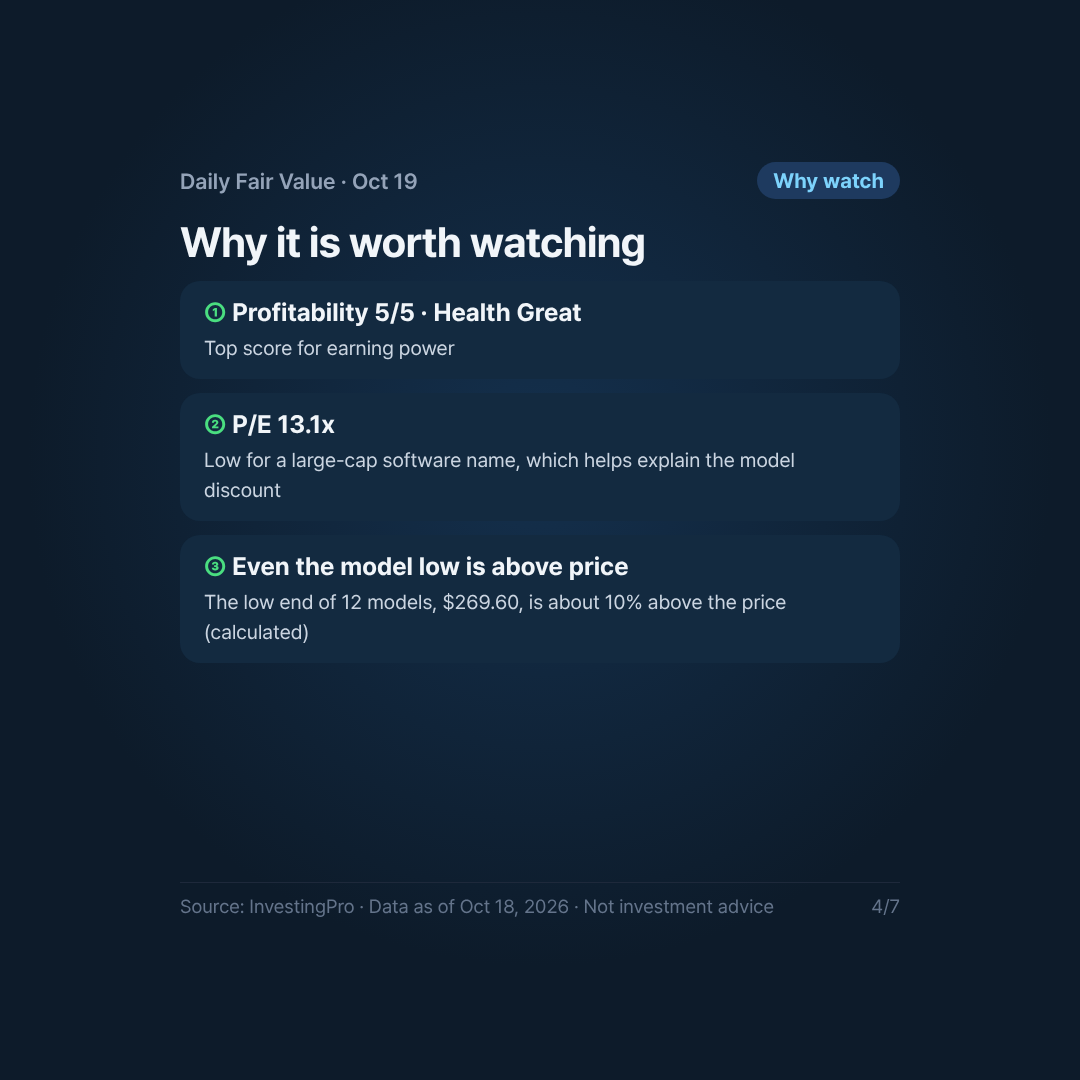
With MED uncertainty and 12 models, the estimate is reasonably well supported. The low end of the spread ($269.60) is still about 10% above the current price (calculated).
Analysts are much more cautious
The analyst average ($272.31) is about 32% below the Fair Value average (calculated), close to the bottom of the model spread. Even the highest target ($373) is below the Fair Value average. The lowest target ($195) is about 20.5% below the current price (calculated). The models price in current earnings power. The Street seems to doubt future growth. Salesforce shows a similar split; see our Fair Value Spotlight for the week of Oct 19.
Financial Health: Great
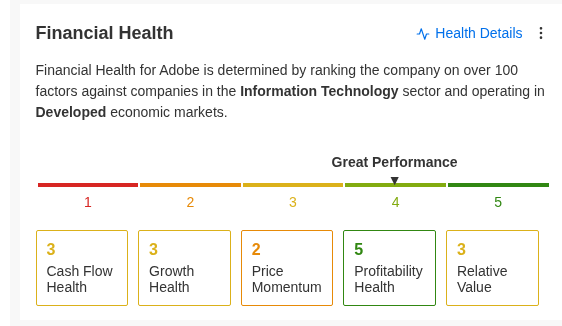
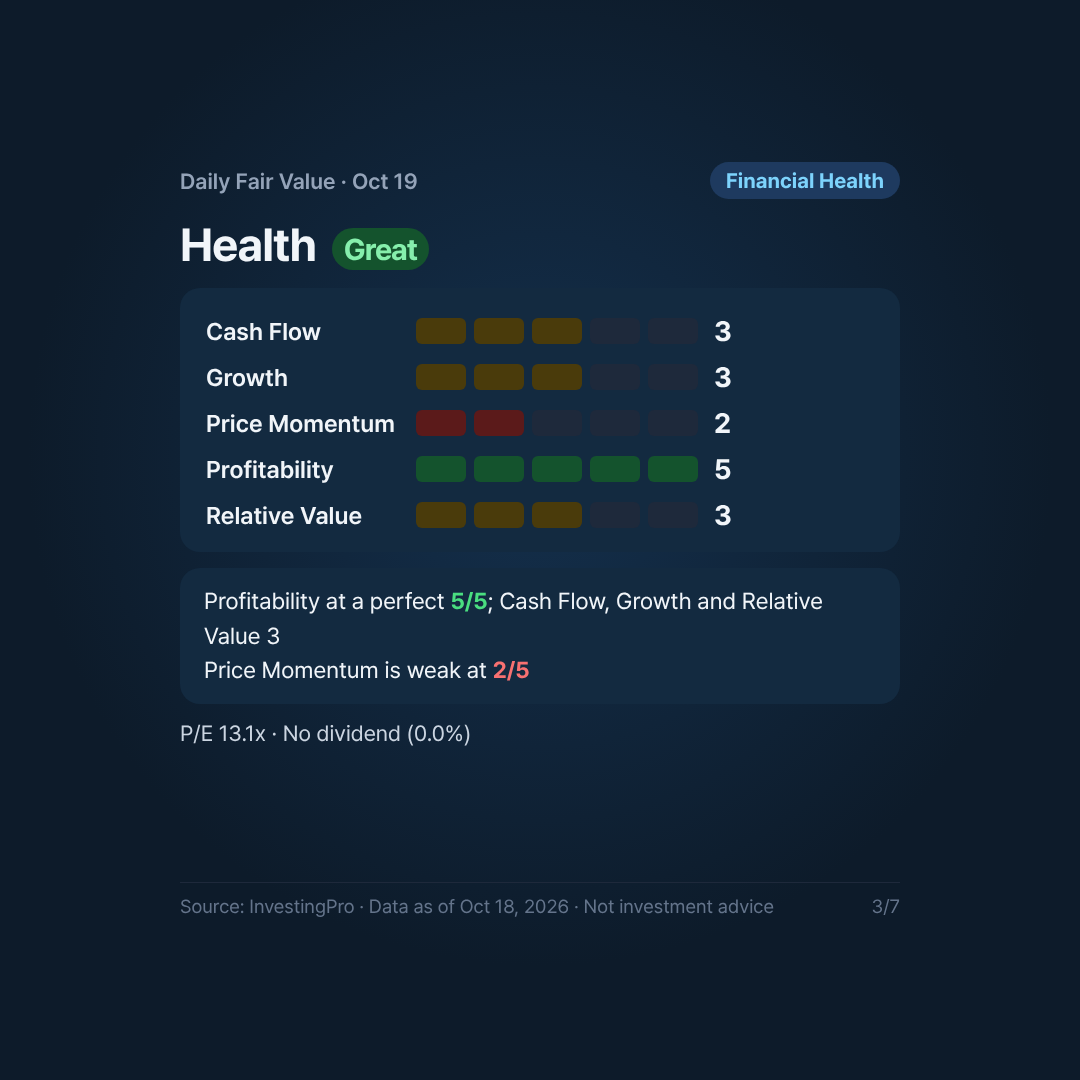
| Sub-score | Score (1-5) | Read-through |
|---|---|---|
| Cash Flow | 3 | Average |
| Growth | 3 | Average |
| Price Momentum | 2 | Weak; price is about 32.6% below the 52-week high of $363.70 (calculated) |
| Profitability | 5 | Top tier |
| Relative Value | 3 | Mid-pack vs. sector |
A perfect 5 on Profitability drives the Great rating. Cash Flow, Growth and Relative Value are steady 3s, and Price Momentum at 2 is the weak link: a highly profitable business whose stock has lagged.
Risks
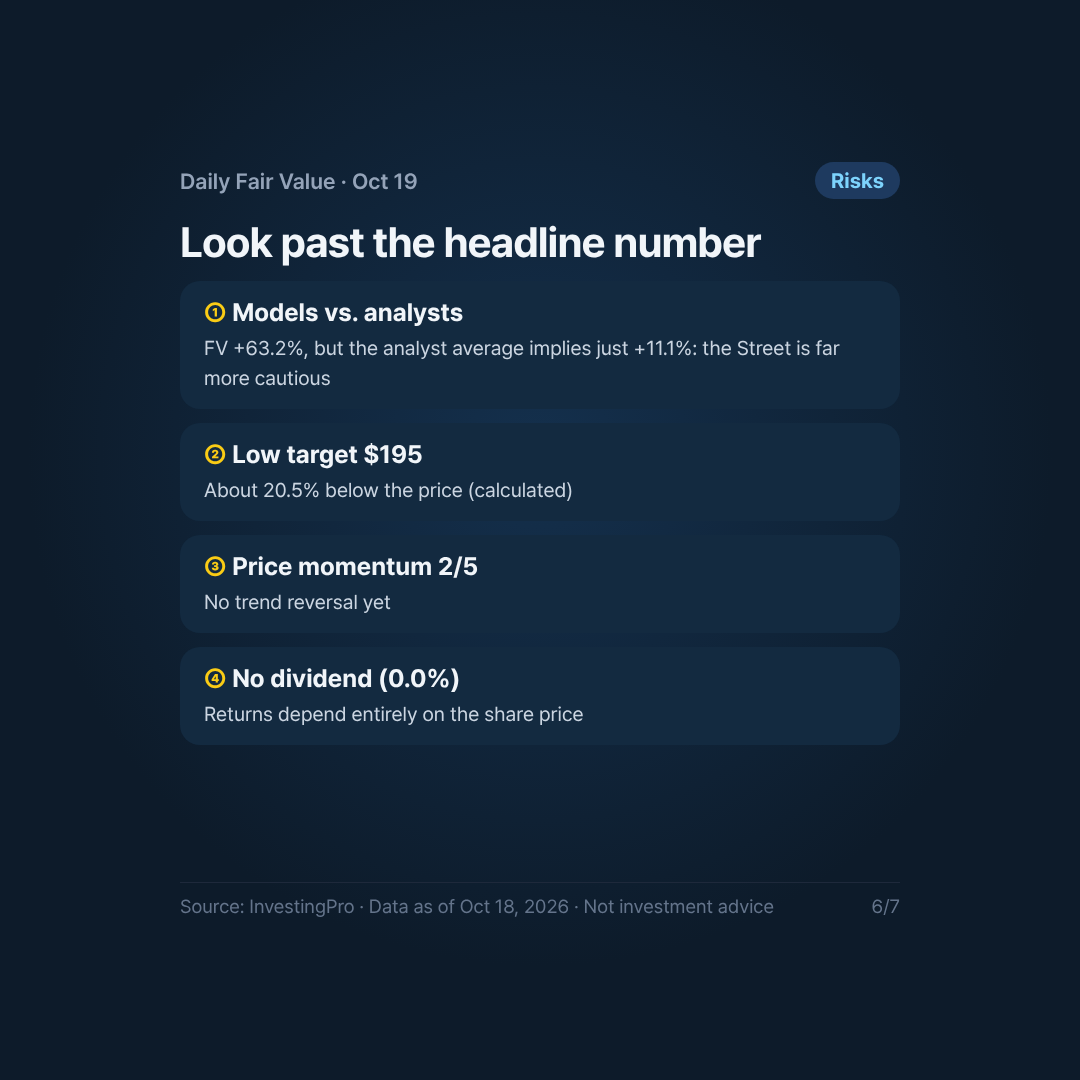
- Model-vs-analyst gap: +63.2% vs. +11.1% (calculated). Relying on Fair Value alone could set expectations too high.
- Low target: $195, about 20.5% below the price.
- Weak momentum (2/5): no trend reversal yet.
- No dividend (0.0%): returns depend entirely on price.
Implications (not a recommendation)
Adobe combines top-tier profitability, a large model discount and a cautious Street. A 13.1x P/E is low for a large-cap software name, which explains the model view. But the low multiple may also reflect doubts about growth. Watch whether analyst targets move toward Fair Value, whether momentum improves, and how estimates change after the next earnings report. For the opposite case, where analysts sit far above the models, see our SK Hynix fair value analysis.
This content is an analysis based on InvestingPro data and is not investment advice. Past performance does not guarantee future results.
Data as of October 18, 2026 (October 16 close). Source: InvestingPro